
Page 39 - 2021_03-Haematologica-web
P. 39
Multicenter validation of targeted NGS in CLL
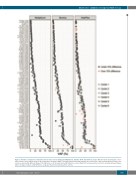
Figure 2. Pairwise comparison of mutations detected by centers utilizing the Multiplicom, Illumina TSCA and HaloPlex assays. Mutation plots depicting the concor- dance and accuracy (narrow range) of the variant allele frequency (VAF) of variants found in this study. Variants are listed on the y-axis and variants detected by each center are denoted by different shapes. The VAF scale is on the x-axis and a VAF difference of less than 10% between partner centers is denoted by black shapes while red shapes indicate a VAF difference of greater than 10% between partner centers.
haematologica | 2021; 106(3)
685
