
Page 263 - 2021_02-Haematologica-web
P. 263
Letters to the Editor
In order to understand the strong anti-tumor activity and mechanism of action of 5FTRX in vivo, pharmacoki- netic and pharmacodynamic studies were undertaken in the MV4-11 model. Mice bearing subcutaneous tumor xenografts were treated with control or 5FTRX twice daily for 5 days and were sacrificed 2 hours after the last dose. Two hours prior to analysis the mice received BrdU and pimonidazole (i.p.) to label S-phase cells and hypoxic tumor regions. Proliferating BrdU positive cells were significantly decreased in a dose-dependent man- ner upon treatment with 5FTRX (Online Supplementary
Figure S12A). A concomitant increase in necrosis as assessed by the reduction in nuclear density was observed (Online Supplementary Figure S12B). Widespread elevation of DNA damage in tumor nuclei throughout the tumors was observed by measuring pH2AX levels at all doses (Online Supplementary Figure S12C), indicating double-strand breaks as a result of incorporation of chain terminating 5FTRX nucleotide. A reduction in %pH2AX-positive nuclei were observed in the 100 mg/kg group compared to the lower doses of 5FTRX, but this finding may reflect the extensive necro-
AB
CD
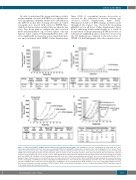
Figure 3. 5-fluorotroxacitabine (5FTRX) targets primary acute myeloid leukemia (AML) cells. (A) MV4-11 cells were xenografted into NOD/SCID mice. Once tumors were approximately 200 mm3, mice were treated with 5FTRX (100 mg/kg BID x 5 days [d]) or cytarabine (Ara-C) (60 mg/kg qD x 5/7 x 2 weeks). Tumor volume was measured over time. Tumor growth inhibition (TGI%) defined as (C1-T1)/(C0-T0) x 100 where C1 and T1 are the mean tumor volumes of control and 5FTRX or Ara-C treated groups at time of tumor extraction, while C0 and T0 are the mean tumor volumes at the start of treatment. Percent regression calculated using: 100 x DT/DC where DT = T1-T0 and DC = C1-C0. Tumor growth delay (TGD) represents anti-tumor efficacy defined as the time taken for tumors to quadru- ple in size (RTV4). (B) OCI-AML2 cells were xenografted into SCID mice. Once tumors were approximately 100 mm3, mice were treated with 5FTRX (30 or 100 mg/kg x 5 days). Tumor volume was measured over time. T/C represents the ratio of mean tumor volume for 5FTRX treated group versus the mean tumor volume for the control group. (C) MV4-11 cells were xenografted into NOD/SCID mice. Once tumors were approximately 200 mm3, mice were treated with increasing amounts of 5FTRX. Tumor volume was measured over time. (D) MV4-11 cells were xenografted into NOD/SCID mice. Once tumors were approximately 200 mm3, mice were treated with increasing amounts of 5FTRX on days 1-4. Mice treated with 30 mg/kg received a second treatment with 5FTRX 10 mg/kg on days 22 to 26. Tumor volume was measured over time.
haematologica | 2021; 106(2)
577
