
Page 262 - 2021_02-Haematologica-web
P. 262
Letters to the Editor
BC
A
DE
FG
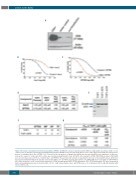
Figure 2. Resistance mechanisms to 5-fluorotroxacitabine (5FTRX ). (A) HEK293 cells were transduced with cDNA encoding cytidine deaminase (CDA) or vector control. Levels of CDA were measured by immunoblotting. (B and C) HEK293 cells over-expressing CDA or vector control were treated with increasing concen- trations of cytarabine (Ara-C) (B) or 5FTRX (C) for 72 hours (h). After incubation, cell growth and viability were measured by MTS assay. Significance of difference in mean IC50 values for control and CDA+ cell line was calculated using Student’s t-test. (D) THP-1 cells resistant to 5FTRX (THP1-5FR) and Ara-C (THP1-ACR) were selected. Data represent the IC50 in mM for Ara-C and 5FTRX in the parental and resistant cell populations. (E) Levels of deoxycytidine kinase (DCK) were measured by immunoblotting in the parental and resistant THP-1 cells. (F) THP-1 parental and resistant cells (THP1-5FR) were treated with 10 mM 5FTRX for 24 h. After incubation, levels of intracellular metabolites (5FTRX monophosphate [MP], 5FTRX diphosphate [DP], 5FTRX triphosphate [TP] were measured by liquid chromatography-mass spectrometry (LC-MS). (G) IC50 (mM) of gemcitabine, Ara-C and 5FTRX alone or in combination with 50 mM dCK inhibitor (dCKi 15c7) in THP-1 cells.
576
haematologica | 2021; 106(2)
