
Page 246 - 2021_02-Haematologica-web
P. 246
M.M. Ouseph et al.
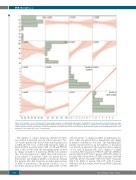
Figure 3. Percentage of loss of chromosome Y demonstrates positive correlation with total number of mutations as well as number of mutated genes by multi- variate analysis. Scatterplot matrix demonstrating correlation between age, percentage of metaphases with loss of chromosome Y, total number of mutations and number of genes mutated. Correlation coefficient for individual correlations provided in each scatterplot. Horizontal bar graphs demonstrating distribution of each parameter is also shown. LOY: loss of Y chromosome.
The number of somatic mutations identified by NGS was variable for patients over the follow-up period. Two out of three patients who did not demonstrate progression to MDS showed a loss of detectable mutations (with an initial KDM5A mutation with a VAF of 0.05 and PPM1D with a VAF of 0.06) while the remaining patient showed no change in number of mutations. Of the four patients who showed progression to MDS, three had an increase in the number of mutations, while one patient did not demonstrate any change in number of mutations. Among five patients who had diagnostic morphological features of MDS at presentation, one patient showed a loss of detectable mutations (CUX1 with an initial VAF of 0.14)
with persistence of diagnostic MDS morphological fea- tures, while one patient did not demonstrate any change in number of mutations over time. The remaining three patients showed increases in the numbers of mutations over the follow-up period. The mutations that accumulat- ed over time in patients who had a diagnosis of MDS occurred in TET2 (2 patients, VAF 0.18 and 0.21), ZRSR2 (1 patient, VAF 0.14), RUNX1 (1 patient, VAF 0.05), ASXL1 (2 patients, VAF 0.36 and 0.09), SETBP1 (2 patients; VAF 0.24 and 0.18), STAG2 (1 patient; VAF 0.23), IDH1 (1 patient, VAF 0.31), STAT3 (1 patient, VAF 0.37), CBL (1 patient, VAF 0.23), CBLB (1 patient, VAF 0.13) and PHF6 (1 patient; VAF 0.29).
560
haematologica | 2021; 106(2)
