
Page 248 - 2021_02-Haematologica-web
P. 248
M.M. Ouseph et al.
and disease-associated LOY in MDS, but CD34 selection for chromosome analysis is not used in the clinical set- ting.14
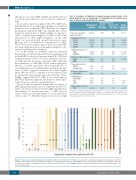
Table 4. Prevalence of mutations in myeloid neoplasia-related genes in the cohort with ≥75% loss of chromosome Y is comparable to the reported preva- lence in patients with myelodysplastic syndrome.
In our series, marrow samples with ≥75% LOY had a high likelihood of morphological diagnosis of myeloid neoplasia, most commonly MDS. Our data also suggest that patients with ≥75% LOY who initially have a non- diagnostic marrow have a higher likelihood of progres- sion to a morphological diagnosis of MDS on follow-up. The presence of <25% LOY metaphases, on the other hand, was associated with normal bone marrow mor- phology and a low likelihood of progression to MDS. These observations further support the notion that LOY involving a high proportion of metaphases might be a dis- ease-associated genomic alteration.
To our knowledge, no published study has evaluated the presence of myeloid-type mutations in patients with isolated LOY. In our cohort, patients with ≥75% LOY had a high prevalence (>80%) of somatic mutations associat- ed with myeloid neoplasia, especially MDS. Although these mutations, as with LOY, can be seen in aging pop- ulations (so-called age-related clonal hematopoiesis or clonal hematopoiesis of indeterminate potential), the inci- dence of these frequent alterations was much higher when LOY was ≥75% compared to the incidence found in age-matched populations from the literature. These findings suggest that ≥75% LOY is associated with an MDS-type mutation signature and therefore likely repre- sents disease-associated clonal proliferation.22
The molecular mechanisms behind the association of LOY, aging and neoplasia are not completely understood. There is no clear association between LOY and numerical abnormalities of other chromosomes.9,27,53 LOY does not seem to reflect an overall propensity to loss of small-sized chromosomes.60,61 Alternative proposed causes for a high
Current ≥75% LOY cohort
81%
32% 3% 13% 10%
26% 3%
10%
7%
7% 3%
3%
3% 7% 7%
3%
Myelodysplastic syndrome
72-90%
15-32% 10-17% 7-12% 3-11%
20-32% 5-13%
Current LOY cohort
58%
12% 2% 4% 4%
13% 4%
6%
Healthy individuals >70 years
5-10%
0.1-0.2% <0.1% <0.1%
0.3-0.4% 1.5-2%
0.3-0.4%
<0.1%
<0.1% 0.2%
<0.1%
Mutation frequency
Proportion of patients with any mutation
Splicing factor genes
SF3B1 SRSF2 U2AF1 ZRSR2
DNA methylation genes
TET2 DNMT3A
Histone modification genes ASXL1 11-23%
EZH2
Transcription factors
SETBP1 BCOR/BCORL
Cohesin complex genes
STAG1/STAG2
Signaling genes
NRAS/KRAS CBL
JAK2
Tumor suppressor gene
TP53
5-12% 2%
2-5% 2% 4% 3%
4-7% 1%
5-10% 2% 2-5% 3% 2-5% 4%
5-10% 2%
Comparison of mutation frequency in patients with loss of chromosome Y with a reported inci- dence of mutations in the healthy aging population and patients with myelodysplastic syn- drome.The table is adapted from Table 45-3 of the paper by Hasserjian et al.33 % LOY: percentage of metaphases with loss of Y chromosome.
Figure 4. Progression of somatic mutations in 12 patients with loss of chromosome Y. Striped bars represent a pathological diagnosis of no dysplasia or minimal dysplasia, while solid bars represent pathological diagnosis of myelodysplastic syndrome (Each alphabet letter corresponds to one patient). The height of bars rep- resents the percentage of metaphases with loss of chromosome Y. Black dots on bars highlight number of mutations identified for the corresponding samples. LOY: loss of Y chromosome.
562
haematologica | 2021; 106(2)
