
Page 223 - 2021_02-Haematologica-web
P. 223
sCADM1 as a new diagnostic marker of ATLL
before and after treatment with chemotherapy (Figure 4). Although the pre- and post-treatment samples were not derived from the same patients, median plasma sCADM1 levels were significantly decreased in the peripheral blood
of patients with acute and lymphoma-type ATLL after chemotherapy compared to before treatment (Figure 4A). Additionally, the serum sIL2R levels in acute and lym- phoma-type ATLL patients after chemothe-rapy were sig-
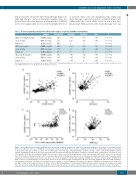
Table 2. Receiver operating characteristic (ROC) curve analysis of plasma sCADM1 concentrations.
ATLL (acute/lymphoma type) versus healthy
volunteers
ATLL (chronic type)
versus healthy volunteers
ATLL (smoldering type) versus healthy
P<0.0001 P=0.0002 P<0.0001 P=0.0024 P<0.0001 P<0.0001 P=0.0082 P=0.0020 P<0.0001
Marker
sCADM1 (ng/mL) WBC (×100/mL) sIL2Rα (U/mL) sCADM1 (ng/mL) WBC (×100/mL) sIL2Rα (U/mL) sCADM1 (ng/mL) WBC (×100/mL)
Cut-off Point
232.4 92.5 494.5 233.4 76.5 470.0 214.6 62.5
436.5
Sensitivity
0.873 0.630 1.0 0.609 1.0 1.0 0.481 0.627 0.955
Specificity AUC
0.971 0.937 0.969 0.786 1.0 1.0 0.971 0.739 0.875 0.981 1.0 1.0 0.912 0.657 0.719 0.692
P
sIL2Rα (U/mL)
The Youden index was used to determine cut-off values. ATLL: adult T-cell leukemia/lymphoma; AUC: area under the ROC curve; SCADM1: soluble form of cell adhesion mole-
volunteers
1.0 0.986
cule 1; WBC: white blood cell; sIL2Rα: serum interleukin-2 receptor α.
AB
CD
Figure 3. Association between plasma sCADM1 levels and various prognostic indicators in adult T-cell leukemia/lymphoma. (A) Scatter plot of plasma soluable form of cell adhesion molecule 1 (sCADM1) concentrations versus serum interleukin-2 receptor α (sIL2Rα) concentrations in 34 healthy volunteers, 78 human T-cell leukemia virus type 1 (HTLV-1) carriers, 77 smoldering-type, 55 chronic-type, 34 lymphoma-type, and 69 acute-type adult T-cell leukemia/lymphoma (ATLL) patients, including those who were previously untreated and treated with chemotherapy. Spearman correlation coefficient values (r) and P-values are shown on each of the graphs. (B) Scatter plot of plasma sCADM1 concentrations versus serum lactate dehydrogenase (LDH) concentrations in 45 HTLV-1 carriers, 69 smoldering- type, 38 chronic-type, 18 lymphoma-type, and 60 acute-type ATLL patients, including those who were previously untreated and treated with chemotherapy. Spearman correlation coefficient values (r) and P-values are shown on each of the graphs. (C) Scatter plot of plasma sCADM1 concentrations versus proviral load (PVL) in 66 HTLV-1 carriers, 56 smoldering-type, 56 chronic-type, and 61 acute-type ATLL patients, including those who were previously untreated and treated with chemother- apy. Spearman correlation coefficient values (r) and P-values are shown on each of the graphs. (D) Scatter plot of plasma sCADM1 concentrations versus white blood cell (WBC) counts in 32 healthy volunteers, 71 HTLV-1 carriers, 74 smoldering-type, 57 chronic-type, 33 lymphoma-type, and 69 acute-type ATLL patients, including those who were previously untreated and treated with chemotherapy. Spearman correlation coefficient values (r) and P-values are shown on each of the graphs.
haematologica | 2021; 106(2)
537
