
Page 222 - 2021_02-Haematologica-web
P. 222
S. Nakahata et al.
increases in the percentages of CD4+CADM1+ T cells, WBC concentrations, or serum sIL2R levels in acute-type ATLL patients compared to chronic-type ATLL patients (Online Supplementary Figure S8A-D). Notably, a strong pos- itive correlation was found between the absolute number of circulating CD4+CADM1+ T cells and sCADM1 concen- tration in the peripheral blood of chronic-type and acute- type ATLL patients (Online Supplementary Figure S9A-B). Given that sCADM1 expression did not significantly differ between chronic-type and acute-type ATLL (Figure 1B), the drastic increase in sCADM1 levels in acute-type ATLL is possibly ascribed to an increase in numbers of circulating tumor cells. Additionally, univariate and multivariate logis- tic regression analyses were performed to assess factors associated with aggressive ATLL compared with indolent ATLL. In the univariate analysis, the risk factors associated with aggressive type ATLL were sCADM1, sIL2R , LDH,
and WBC (Table 1). On the other hand, in multivariate analysis, sCADM1 was the only risk factor associated with aggressive ATLL (Table 1). Furthermore, the Kaplan-Meier analysis in aggressive type ATLL patients showed a trend towards worse overall survival for patients with high sCADM1 (Online Supplementary Figure S10A-D, Online Supplementary Table S2). Taken together, these results sug- gest that sCADM1 has potential as a novel diagnostic bio- marker in ATLL, and that it may be useful for monitoring disease progression.
The plasma sCADM1 level is a useful clinical indicator of the leukemic cell burden in ATLL patients
In order to investigate the clinical value of plasma sCADM1 concentration, we evaluated the levels of plasma sCADM1 along with sIL2R , LDH, PVL, and WBC in the peripheral blood of patients with various types of ATLL
Table 1. Univariate and multivariate analysis of factors predicting aggressiveness of adult T-cell leukemia/lymphoma.
Variable OR
Age 1.01
Univariate analysis
95% CI P OR
3.13-9.54 <0.0001 4.33
1.49-2.28 <0.0001 1.22
3.48-13.8 <0.0001 2.22
1.22-2.44 0.002 0.617
0.94-1.38 0.158 0.855
0.98-1.04 0.385 1
Multivariate analysis 95% CI
2.06-9.10
0.895-1.67
0.944-5.21
0.349-1.09
0.611-1.2
0.957-1.05
P
<0.0001
0.205
0.068
0.096
0.359
0.963
sCADM1 5.46
sIL2Rα 1.85 LDH 6.93 WBC 1.72 PVL* 1.14
For logistic regression analysis, numerical values of soluble for of cell adhesion molecule 1 (sCADM1), serum interleukin-2 receptor α (sIL2Rα ), lactate dehydrogenase (LDH), white blood cell (WBC),and proviral load (PVL) were converted to base 2 logarithm transformation.The data from 49 aggressive type (40 acute-type and nine lymphoma-type) and 83 indolent type adult T-cell leukemia/lymphoma (ATLL) cases (18 chronic-type and 65 smoldering-type) (Online Supplementary Figure S5) were used in the analysis.*Forty- two cases with missing values on PVL (eight acute-type, eight chronic-type, and 17 smoldering-type) and nine lymphoma type ATLL were excluded.
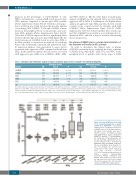
Figure 2. Plasma sCADM1 levels in adult T-cell leukemia/lymphoma patients examined by AlphaLISA. The plasma soluble form of cell adhesion molecule 1 (sCADM1) levels in 34 healthy volunteers, 78 human T-cell leukemia virus type 1 (HTLV-1) carriers, 12 HTLV-1-associated myelopathy/tropical spastic paraparesis (HAM/TSP) patients, 77 smoldering-type, 23 chronic-type, 13 lymphoma-type, and 43 acute-type ATLL patients who were pre- viously untreated were measured by AlphaLISA using anti-CADM1 antibodies. The box and whisker plots show the 5th, 25th, 50th (median), 75th, and 95th per- centile values, with outliers marked by
*P<0.05, **P<0.01,
solid dots.
***P<0.001 versus healthy volunteers or HTLV-1 carriers (Kruskal-Wallis test/Dunn's multiple comparison test). Median and 5th and 95th percentile values are indicated at the top of each column. The dot line indicates the 95th percentile of plasma sCADM1 in healthy subjects.
536
haematologica | 2021; 106(2)
