
Page 128 - 2021_02-Haematologica-web
P. 128
T. Raskovalova et al.
10.9 0.8 0.7 0.6 0.5 0.4 0.3 0.2 0.10
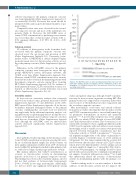
Figure 2. The AUC-ROC curves receiver operating characteristics curves for chi- totriosidase activity, CCL18 concentration, and the combination of these two biomarkers. CI: Confidence Interval. AUC: area under the curve; ROC: receiver operating characterists.
0 0.1 0.2 0.3 0.4 0.5 0.6 0.7 0.8 0.9 10 1 . Specificity
(95% CI: 0.77-0.87) (95% CI: 0.79-0.88)
(95% CI: 0.80-0.89)
selective reporting for the primary composite outcome was found graphically (Online Supplementary Appendix 12) or statistically (P=0.20). However, this result should be interpreted with caution, given the limited number of pri- mary studies.
Comparable effect sizes were observed for the second- ary composite outcome and most of the individual com- ponents (Table 2). However, the AUC-ROC curve of serum CCL18 concentration for predicting severe anemia was lower than that of chitotriosidase activity (0.64 vs. 0.81, summary difference, -0.17, 95% CI: -0.33 to -0.08, P=0.008).
Subgroup analysis
No evidence of heterogeneity in the biomarker levels associated with the primary composite outcome was observed across the age groups and provision of ERT (Online Supplementary Appendix S13). Conversely, lower- quality studies (<5 QUADAS-2 criteria) displayed higher geometric mean ratios for chitotriosidase activity, accord- ing to the primary outcome (Online Supplementary Appendix 13).
Differences in the AUC-ROC curves for the primary composite outcome were homogeneous across the age groups, QUADAS-2 criteria, fluorogenic substrate, and CCL18 assay type (Online Supplementary Appendix S14). However, serum CCL18 concentration was more accurate than chitotriosidase activity in discriminating patients with the primary composite outcome among those receiving ERT (Online Supplementary Appendix S14). No evidence of heterogeneity in serum CCL18 concentration accuracy as a function of chitotriosidase activity deficiency was found (Online Supplementary Appendices S15-16).
Sensitivity analysis
In leave-one-out sensitivity analysis that iteratively removed one study at a time, geometric mean ratios (Online Supplementary Appendix 17) and differences in the AUC- ROC curves (Online Supplementary Appendix 18) for the two biomarkers remained unchanged relative to the primary outcome, confirming that our results were not driven by any single study. In the additional sensitivity analysis, cod- ing splenectomy as splenomegaly did not modify the asso- ciations of the primary and secondary composite outcomes with the two biomarkers (Online Supplementary Appendix S19), although the AUC-ROC curve for chitotriosidase activity decreased significantly (Online Supplementary Appendix S20).
Discussion
Most published studies reporting on chitotriosidase activi- ty and CCL18 concentration accuracy in assessing GD sever- ity are of relatively limited sample size. In this context, our meta-analysis summarizes evidence from 1,109 observations nested within 334 participants enrolled in nine primary stud- ies, with a broad range of patient age and disease severity.
Our analysis indicates that CCL18 concentration is as accurate as chitotriosidase activity in discriminating patients on the basis of our primary composite outcome. This finding was robust in the sensitivity analysis, and we did not find evidence of between-study heterogeneity (I2=0%, P=0.68) in two-stage meta-analysis. Additionally, we did not detect any significant heterogeneity among
studies and patient subgroups, although CCL18 concentra- tion may be more accurate in patients receiving ERT. Our primary result is also supported by consistency in the effect sizes for most of the individual outcome components and the secondary composite outcomes.
Our meta-analysis corroborates and extends evidence from previous studies showing that chitotriosidase activity and CCL18 concentration relate to visceral and hematologi- cal parameter abnormalities in treated and untreated patients.8,12,13,15 A noteworthy exception was severe anemia (< 8 g/dL), for which CCL18 showed a lower AUC-ROC curve than chitotriosidase activity. This observation is con- sistent with our failure to show a significant difference in the CCL18 level for patients with and without severe anemia. Interestingly, weak or variable associations were previously reported between hemoglobin concentration and chi- totriosidase activity or CCL18 concentration.12,13,15 A poten- tial explanation might relate to the failure of physicians to correctly diagnose concurrent causes of severe anemia in GD patients. Yet, this cannot explain why the accuracy dif- fered between chitotriosidase activity and CCL18 concen- tration. Due to the limited number of severe anemia cases in our meta-analytical sample (i.e., 7 among the 1,036 observa- tions from 309 participants), our findings should be inter- preted with caution and deserve confirmation in independ- ent samples. Consistent with previous studies,47,48 we found that splenectomy altered the accuracy of chitotriosidase activity in discriminating patients with the primary out- come.
Another striking result of our meta-analysis is that the addition of chitotriosidase activity did not improve the
442
haematologica | 2021; 106(2)
Sensitivity
