
Page 127 - 2021_02-Haematologica-web
P. 127
Biomarkers in Gaucher disease
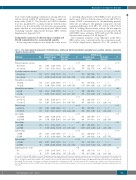
bone events with imaging confirmation, among 218 obser- vations nested within 97 participants from a single pri- mary study (Table 1). The decrease in CCL18 concentra- tion was paralleled by a similar trend in chitotriosidase activity over the 24 months of follow-up, among partici- pants enrolled in four industry-sponsored clinical trials evaluating enzyme replacement therapy (ERT) (Online Supplementary Appendix S10).
Comparative accuracy of chitotriosidase activity and CCL18 concentration for assessing GD severity
In one-stage meta-analysis, area under the curve receiv-
er operating characteristics (AUC-ROC) curve point esti- mates were 0.82 for chitotriosidase activity and 0.84 for serum CCL18 concentration for discriminating patients with GD according to the primary composite outcome (summary difference: 0.02, 95% CI: -0.02 to 0.05, P=0.32, Table 2). Adding chitotriosidase activity did not improve serum CCL18 concentration accuracy, as indicated by the AUC-ROC curve estimates (0.85 with and 0.84 without chitotriosidase activity, P=0.18) (Figure 2).
The summary estimates of the difference in the AUC- ROC curves were consistent in the two-stage meta-analy- sis (Online Supplementary Appendix S11). No evidence of
Table 1. One-stage unpaired comparisons of chitotriosidase activity and CCL18 concentration according to pre-specified outcomes among type I Gaucher disease patients.
Chitotriosidase activity, nmol/mL/h
CCL18, ng/mL
Outcomes No.
Primary composite outcome†
No outcome 212 ≥ 1 outcome 280
Secondary composite outcome‡
Geometric mean (95%CI)
Mean ratio (95% CI)*
1.00 (...) 5.29 (4.24 - 6.61)
1.00 (...)
4.35 (3.35 - 5.64)
1.00 (...) 2.96 (2.44 - 3.59)
1.00 (...)
2.02 (1.00 - 4.10)
1.00 (...) 4.03 (3.46 - 4.70)
1.00 (...)
2.94 (2.32 - 3.73)
1.00 (...) 3.96 (3.30 - 4.76)
1.00 (...)
3.16 (1.59 - 6.27)
1.00 (...) 5.43 (4.45 - 6.63)
1.00 (...)
4.14 (3.08 - 5.56) 1.00 (...)
1.47 (0.78 - 2.79)
P
<0.001
<0.001
<.001
.05
<.001
<.001
<0.001
0.001
<0.001
<0.001
0.24
Geometric mean (95% CI)
Mean ratio (95% CI)*
1.00 (...) 3.04 (2.57 - 3.58)
1.00 (...)
3.05 (2.53 - 3.68)
1.00 (...) 2.28 (1.97 - 2.64)
1.00 (...)
1.39 (0.82 - 2.37)
1.00 (...) 2.71 (2.42 - 3.03)
1.00 (...)
2.15 (1.81 - 2.55)
1.00 (...) 2.59 (2.26 - 2.96)
1.00 (...)
2.25 (1.35 - 3.74)
1.00 (...) 3.22 (2.77 - 3.75)
1.00 (...)
3.21 (2.59 - 3.97) 1.00 (...)
1.22 (0.81 - 1.81)
P
<0.001
<0.001
<0.001
0.22
<.001
<.001
<.001
0.002
<0.001
<0.001
0.34
1,478 7,623
2,701
13,516
3,136 10,984
3,509
17,520
758 2,413 313 8,495
958 3,121
113 8,890
447 2,242 240 10,181
678 3,700
9 30,353
240 1,583 265 8,111
434 2,871
71 18,539 206 1,618
12 3,556
(1,235 - 1,768) (6,520 - 8,913)
(2,349 - 3,106)
(10,143 - 18,011)
(2,836 - 3,468) (7,841 - 15,386)
(3,178 - 3,876)
(8,076 - 38,005)
(2,156 - 2,700) (7,339 - 9,833)
(2,825 - 3,449)
(6,569 - 12,030)
(1,954 - 2,572) (8,724 11,880)
(3,290 - 4,161)
(16,362 - 56,308)
(1,338 - 1,873) (6,933 - 9,488)
(2,515 - 3,276)
(13,323 - 25,796) (1,335 - 1,961)
(1,894 - 6,674)
198 679
311
1,050
406 1,057
445
666
343 856
412
928
317 886
447
1,479
209 740
335
1,319 449
786
(177 - 221) (612 - 755)
(283 - 342)
(879 - 1,254)
(381 - 432) (883 - 1,265)
(418 - 473)
(331 - 1,340)
(321 - 368) (782 - 937)
(387 - 438)
(786 - 1,094)
(291 - 346) (800 - 980)
(415 - 482)
(1,019 - 2,145)
(188 - 232) (666 - 822)
(306 - 367)
(1,076 - 1,616) (402 - 501)
(407 - 1,518)
No outcome 391
≥ 1 outcome 101 Hemoglobin concentration
≥ 11 g/dL 934
< 11 g/dL 102
Hemoglobin concentration
≥ 8 g/dL 1,029
<8g/dL 7 Platelet count
≥ 100x109/L
< 100x109/L Platelet count
≥ 50x109/L
< 50x109/L Liver volume < 1.25 MN
≥ 1.25 MN Liver volume
<2.5MN
≥2.5MN Spleen volume
No
Yes
<5MN
≥5MN Spleen volume
<15MN
≥15MN
Symptomatic bone events#
CI:confidence interval;MN:multiple of normal.*Summary geometric mean ratios and P-values for unpaired comparisons were derived from 3-level random intercept regression models for continuous dependent variables, with observations nested within patients and studies. †The primary outcome was a composite of hemoglobin concentration < 11 g/dL (< 10 g/dL for patients 12-59 months of age), platelet count < 100x109/L, spleen volume > 5 MN, and liver volume> 1.25 MN. Patients with splenectomy were excluded from this analysis.‡The secondary outcome was a composite of hemoglobin concentration < 8 g/dL (< 7 g/dL for patients 12-59 months of age),platelet count < 50x109/L,spleen vol- ume > 15 MN,and liver volume > 2.5 MN.Patients with splenectomy were excluded from this analysis.# Osteonecrosis or fracture with imaging confirmation within the previous 12 months.
haematologica | 2021; 106(2)
441
