
Page 80 - 2020_11-Haematologica-web
P. 80
S. Singbrant et al.
Supplementary Figure 3A), albeit from low levels, with vir- tually no contribution to reticulocytes from sMPP during the first week (Online Supplementary Figure 3B). sBFU-E also dominated the overall contribution to erythroid cells during the first two weeks of recovery (Figure 2G, P≤0.0001 and P≤0.01, respectively.). All cell populations gave rise to CD41+ cells short after transplantation (Figure 2H), whereas only sMPP produced platelets, which dis- played slower kinetics compared to the formation of ery- throid cells (Figure 2I; P≤0.0001). In agreement with the colony formation ability in vitro, myeloid (Figure 2J) as well as lymphoid lineages (Online Supplemental Figure S3C-D) were mainly derived from sMPP.
The KuO+ blood lineage distribution and repopulation kinetics in spleen after transplantation was largely reflec- ted by that observed in PB (Online Supplemental Figure S4), while the BM had a considerably slower repopulation pat- tern (Online Supplemental Figure S5).
Morphological analysis of spleens at 2 weeks post trans- plantation revealed a strikingly different distribution of repopulating cells (Figure 2K). Progeny from sBFU-E was evenly distributed throughout the spleen with occasional KuO– clones possibly arising from the support BM. In con- trast, sMPP gave rise to a limited number of large clones, consistent with spleen colonies formed by more primitive stem/progenitor cells (CFU-S12).23 Taken together, in vivo tracing demonstrated clear separation of functionally dis- tinct populations within cKit+CD71low/CD24alow cells using the additional markers CD150, CD9 and Sca1, where sBFU-E mediated recovery from irradiation-induced acute anemia by providing a transient wave of erythroid cells in the PB and spleen, followed by multi-lineage reconstitu- tion in the PB, spleen and BM from sMPP.
Stress-BFU-E and stress-CFU-E display opposing expres- sion patterns of BMP- and CBFA2T3-responsive genes
To identify gene expression patterns associated with the distinct features of the radio-protective sBFU-E, RNA- sequencing was performed on FACS sorted stress-progeni- tor populations from day 8 spleens. Unsupervised clustering of genes with significant differential expression between any of the investigated populations revealed that relatively few genes were uniquely expressed by sBFU-E, about half of the genes differing between progenitor populations were shared between sMPP and sBFU-E (Figure 3A, gene lists for each cluster in the Online Supplemental Table S1), while the sCFU-E were clearly distinct from the other two populations. Gene set enrichment analysis (GSEA)24 revealed that genes that were uniquely up-regulat- ed in sMPP were associated with adult tissue stem cells and long-term hematopoietic stem cells (Figure 3B), while genes up-regulated in sBFU-E were associated with MAPK signal- ing, response to stress and stimulus, and more mature hematopoietic progenitors (Figure 3B). Interestingly, both sMPP and sBFU-E expressed BMP- as well as CBFA2T3 tar- get genes known to be up-regulated in response to Bmp or Cbfa2t3 inactivation respectively (Figure 3B). sCFU-E on the other hand, uniquely expressed genes correlating with late progenitors, heme metabolism, and BMP- and CBFA2T3-responsive genes reported to be down-regulated in response to Bmp or Cbfa2t3 inactivation (Figure 3B).
The differential expression of BMP-responsive genes in sCFU-E and more primitive stress-progenitors is well in line with previous findings showing that effective generation of erythroid stress-progenitors is BMP-dependent. To explore
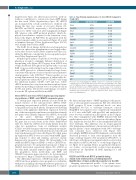
Table 2. Top 20 down-regulated genes in stress-BFU-E compared to steady-state.
Gene symbol
F13a1
Snord15a Tifab Csf1r Cybb Unc93b1 Lgals1 Cf10 Snord15b Rasa4 Cd209a Klf4
Lrp1 Pik3r5 Itsn1 Ccr2 Ly6c2| Trim47 Nhsl2 Irf8
log2 fold change
-2,754
-2,519
-2,413
-2,358
-2,344
-2,321
-2,265
-2,250
-2,197
-2,127
-2,124
-2,115
-2,024
-1,939
-1,907
-1,860
-1,859
-1,847
-1,796
-1,783
-log10 FDR
29,923
23,305
16,746
16,322
13,756
25,436
14,959
14,576
43,032
13,580
10,439
10,450
9,143
8,927
21,849
7,775
7,727
8,101
7,029
7,515
The genes most down-regulated in sBFU-E compared to steady-state included the coagulation factor F13a1/FxIIIa expressed by monocytes and megakaryocytes, Tifab; a del(5q) MDS gene known to regulate hematopoiesis and mediate immune signaling through the Toll-like receptor–TRAF6 pathways,41 the Kit paralog Csf1r; essential for the survival of monocytes and macrophages,42 and Cybb/gp91-phox; a heme-binding membrane glycoprotein that is a phagocyte respiratory burst oxidase component induced by inflammation.43
the functional importance of BMP-signaling for the genera- tion of stress-progenitor populations, BM cells deficient in BMP receptor II from conditional knock out mice (BmprIIfl/fl Vav-Cre) or wild-type littermate controls (BmprIIfl/fl Cre-negative) were competitively transplanted at a 1:1 ratio with KuO+ wild-type BM, and analyzed for stress recovery contribution in the spleen on day 8 (Figure 3C). Mice transplanted with BMPRII deficient BM had smaller spleens and a 36% reduction in cells/spleen (Figure 3D), despite the fact that 50% of the transplanted BM cells were wild-type. This difference was no longer apparent after lymphoprep-enrichment of mononuclear cells, indicat- ing that spleens of mice transplanted with 100% wild-type cells contained more erythroid cells (Figure 3D). Accordingly, BMPRII-deficient BM displayed a substantially decreased potential to form stress-progenitors from the stage of lineage negative cKit+ progenitors (59.6±5,0% of wild-type), with the most prominent reduction observed in the number of sBFU-E (46.4±6.7% of wild-type) (Figure 3E, see Figure 1C for gating). Hence, in agreement with previ- ous studies, our prospectively isolated stress-progenitor populations are dependent on BMP signaling for a full stress-response.
CD150 and CD9 mark BFU-E potential during steady-state erythropoiesis, providing improved identification of myelo-erythroid progenitors in the BM
Mapping transcriptional profiles of the splenic stress- progenitor populations (see Figure 3) to transcriptional pro-
2568
haematologica | 2020; 105(11)
