
Page 79 - 2020_11-Haematologica-web
P. 79
Isolation and molecular signature of stress-BFU-Es
that sBFU-E and sCFU-E provide a transient wave of reconstitution in PB and spleen, with limited contribution to BM hematopoiesis. In contrast, sMPP increased their output over time, and was the only population that effi- ciently populated the BM and still contributed to hematopoiesis at four weeks (Figure 2C-E).
At two weeks 47.4±7.6% of PB cells were KuO+ in mice transplanted with sBFU-E, compared to 9.0±5.9%
(P≤0.0001) for sCFU-E (Figure 2C). Analysis of the diffe- rentiation potential of transplanted stress-progenitors revealed that sBFU-E gave rise to 57.4±1.9% of reticulo- cytes compared to 17.5±3.5% (P≤0.0001) for sCFU-E, while reticulocytes from sMPP were barely detected (Figure 2F; PB 1 week). Furthermore, the initial overall for- mation of reticulocytes was 2-fold higher in mice trans- planted with sBFU-E compared to sCFU-E (Online
ABC
DE
F
G
H
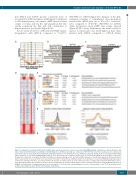
Figure 5. Compared to steady-state BFU-E, stress-BFU-E have enhanced expression of genes associated with BMP signaling, erythropoiesis and proliferation, and have enhanced and differential accessibility to CTCF binding sites. (A) RNA-sequencing was conducted on BFU-E FACS-sorted from steady-state bone marrow and day 8 stress spleens respectively (n=3). Significant differential expression was determined as -log10 FDR>2 and log2 fold change>0.58, for a full list of differentially expressed genes see the Online Supplementary Table S2. (B-C) Cellular processes for genes that were (B) up- and (C) down-regulated in stress-BFU-E compared to steady-state respectively, as analyzed by GSEA. (D) Fishbone heatmap outlining specific and shared ATAC-seq peaks in steady-state and stress BFU-E respectively. Each row represents one peak, and the color represents the intensity of chromatin accessibility. Peak files for heatmap were created in HOMER44 and grouped based on K-means clustering (3-clusters, 100-runs) performed in Cluster3, revealing clusters of peaks enriched in stress- (orange) and steady-state BFU-E (blue) respec- tively. (E-F) Motif analysis was performed on stress (E) and steady-state (F) enriched regions from peak lists extracted from panel D using findMotifsGenome.pl in HOMER. (G) Distribution of identified top motifs was investigated +/- 500 bp from corresponding peak centers. (H) Annotation of the CTCF motif within stress- (orange) and steady-state (blue) BFU-E enriched peaks respectively.
haematologica | 2020; 105(11)
2567
