
Page 78 - 2020_11-Haematologica-web
P. 78
S. Singbrant et al.
CD150+CD9+Sca1+ progenitors gave rise to CD150+CD9+Sca1– in culture (Figure 1H), indicating that more restricted Sca1- progenitors arise from multi-potent Sca1+ progenitors. Taken together, differential expression of cell surface markers CD150, CD9 and Sca1 defines a hierarchy of splenic Lin–cKit+CD71/CD24alow stress-progenitors during irradiation-induced stress recovery in mice (Figure 1I). The stress-BFU-E, forming BFU-E colonies in vitro (CD150+CD9+Sca1–, hereafter referred to as stress-BFU-E or sBFU-E), can be separated from multi-potent stress-progenitors (CD150+CD9+Sca1+, hereafter referred to as stress-MPP or sMPP) and stress- CFU-E (CD150+CD9–, hereafter referred to as stress-CFU- E or sCFU-E) by Sca1 and CD9 expression respectively.
Stress-BFU-E provide a transient wave of primarily erythroid cells, followed by multi-lineage reconstitution from stress-MPP
To determine the kinetics and full in vivo potential of the identified stress-progenitors, we used a transgenic mouse that constitutively expresses the fluorescent protein Kusabira Orange (KuO) in all cells, including erythrocytes and platelets.20 Lethally irradiated recipients were trans- planted with BM from KuO mice, and KuO+ splenic stress- progenitors isolated on day 8 were subsequently trans- planted into secondary recipients, either without support cells to score spleen colony-forming-units day 8 (CFU- S8),21 or together with 105 unfractionated wild-type BM support cells to monitor their in vivo repopulation capacity over time (Figure 2A). sBFU-E demonstrated the highest CFU-S8 potential (Figure 2B), indicative of robust short- term radio-protective capacity. Analysis of overall repopu- lation potential of sorted KuO+ progenitors demonstrated
A
Table 1. Top 20 up-regulated genes in stress-BFU-E compared to steady-state.
Gene symbol
Ctse
Myh10 Aldh1a1 Pop1 Tfrc Psat1 Timm10b Vkorc1 Sipa1 Tmem70 Usp14 Emilin2 Josd1 Psmb2 Suclg1 Trip13 Arap2 Tmem201 Mob1b Atl2
log2 fold change
2,254
1,542
1,529
1,178
1,171
1,133
1,123
1,119
1,117
1,082
1,063
1,062
1,039
1,036
1,035
1,014
1,005
1,001
0,992
0,984
-log10 FDR
19,109
7,858
5,762
2,814
4,072
3,136
2,505
2,652
5,900
2,401
6,477
3,012
3,305
2,079
5,608
2,078
2,132
2,320
2,190
3,323
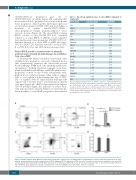
CD
Figure 4. CD150 and CD9 mark BFU-E potential during steady-state erythropoiesis, providing improved identification of myelo-erythroid progenitors in the bone marrow. Gating strategy and colony forming potential (CFU-E; light grey, BFU-E; dark grey) of FACS sorted (A-D) steady-state bone marrow progenitors based on (A-B) classical fractionation using CD150 and CD1059, and (C-D) the new markers CD150/CD9/Sca1. All cells were incubated in 4% O2, and scored on day 4 (CFU-E) or day 7-8 (BFU-E). Data displayed as average ± standard error of the mean (SEM), n.d: not detectable, *P≤0.05, **P≤0.01.
The most highly up-regulated genes in sBFU-E compared to steady-state BFU-E were Ctse/Cathepsin E: an erythrocyte membrane aspartic proteinase previously described as a down-stream target of Foxo3 in erythroid regulation,38 Myh10: a non-muscle myosin involved in cell division of erythroblasts and other cells,39 Aldh1a1: a critical enzyme involved in metabolism of reactive oxygen species and retinoic acid shown to mark adult definitive erythroid fate in mouse and human blood development,and the transferrin receptor Tfrc/CD71.
B
2566
haematologica | 2020; 105(11)
