
Page 142 - 2020_09-Haematologica-web
P. 142
M. Seibold et al.
AB
CD
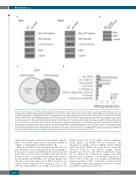
Figure 3. Distinct regulation of the RAL and RAS pathways. (A) NRAS (G12D)-mutated INA-6 cells were transfected with a samll hairpin RNA (shRNA) expression vec- tor against mutated NRAS, KRAS (G12A)-mutated MM.1S cells were transfected with an shRNA expression vector against mutated KRAS. As shown by Western analy- ses, RALA activation was not changed by depletion of oncogenic RAS (and its cognate wild-type form) in either cell line. RALA activation was measured by RALA-GTP pulldown with RALPB1 protein-binding domain agarose beads 48 hours (h) after transfection. RALA and a-tubulin total load samples were taken before the pulldown procedure. (B) To analyze RAL- versus RAS-dependent gene expression, MM.1S cells were transfected with shRNA expression vectors against KRAS or RALA and suc- cessful knockdown was confirmed by Western blotting. RNA was isolated 48 h after electroporation and analyzed with RNA-Seq. Three independent experiments were performed. (C) Of 1,473 genes that were expressed differentially after KRAS knockdown, 656 were up- and 817 downregulated. After RALA knockdown, 771 genes showed an altered expression, whereof 336 were up- and 435 downregulated. Of the 235 genes in the overlap, 135 were up- and 100 downregulated under both conditions. The diagram shows all genes with altered expression with a false discovery rate (FDR) <0.05. In total, 28,440 genes were analyzed. (D) Ontology mapping of differential gene expression highlighting the most distinct functional gene groups with relevance for MM growth and survival after RAL versus RAS knock- down was performed using the Molecular Signatures Database Hallmark Gene Set Collection.40 Adjusted P-value <0.05.
again appeared quite similar between primary samples, with a few notable digressions to the upside (RALA in samples 1 and 5, RALB in sample 5; Figure 1B).
Expression of RAL isoforms in primary plasma cells was also analyzed in situ by immunohistochemical staining of bone marrow biopsies from MM patients (n=26) and com- pared with sections from non-MM (n=5) and MGUS patients (n=10). Co-staining was performed with the plas- ma cell marker CD138 (Figure 1C). Normal plasma cells showed no detectable expression of RALA except for one sample, which displayed weak staining in 10% of the cells. All normal plasma cell samples were negative for
RALB staining. In 5 of 10 samples with pre-malignant MGUS plasma cells RALA was not detectable. The remaining 5 samples showed slightly elevated RALA expression levels. RALB expression did not reach the detection level in any MGUS sample (Online Supplementary Table S1 and Online Supplementary Figure S1). In contrast, 20 of 26 primary samples from MM patients showed medium to strong RALA expression in 80% to 100% of the cells. Two samples showed RALA expression in 25% and 50% of the cells, respectively. In 14 of 26 samples, RALB stained weakly in at least 5 % of MM cells (Online Supplementary Table S2).
2320
haematologica | 2020; 105(9)
