
Page 114 - 2020_09-Haematologica-web
P. 114
2292
J. Zhou et al.
haematologica | 2020; 105(9)
A
B
C
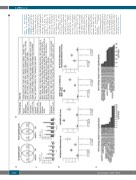
Figure 3. Transcriptome changes in acute myeloid leukemia cells induced by ASLAN003. (A) Venn diagrams showing gene expression data for MOLM-14 and KG-1 cells. The left diagram indicates the numbers of upregulated genes in each and both of the two cell lines and the right diagram represents the numbers of downregulated genes (per- centage in brackets). (B) Functional classification of genes whose expression is altered in both MOLM-14 and KG-1 cell lines. (C) Real-time quantitative reverse transcrip- tase polymerase chain reac- tion confirmed the gene expression changes of five selected genes identified by RNA-sequencing experiments in MOLM-14 and KG-1 cells. The expression of each gene in dimethylsulfoxide (DMSO)- treated cells was set at 1 (baseline). The experiments were performed in triplicate (mean ± standard deviation). *P<0.001; **P<0.05. (D) Single-sample gene set enrich- ment analysis revealed signifi- cantly greater enrichment of myeloid differentiation up-reg- ulation, hematopoietic stem cell downregulation, targets of HoxA9 and Meis1 downregula- tion in ASLAN003-treated MOLM-14 and KG-1 cells, as well as lower enrichment of pyrimidine ribonucleoside triphosphate metabolic process. Individual P values for each pathway in DMSO-treated versus two ASLAN003-treated cell lines are shown. (E) Gene ontology (GO) analysis of up- and down-regulated genes shared between MOLM-14 and KG-1 cells. Bar graphs showed the enriched GO terms of bio- logical processes and their cor- responding P values (-log10).
D
E
