
Page 112 - 2020_09-Haematologica-web
P. 112
J. Zhou et al.
expression: 0.95-1, fold-change cutoff: 1.5) (Figure 3A, Online Supplementary Table S2). We then manually classi- fied the list of genes. Among the genes upregulated by ASLAN003, 27 (8.4%) were related to myeloid differenti- ation, 15 (4.7%) were cell surface antigens, and 8 (2.5%) were associated with apoptosis (Figure 3B). The downreg- ulated gene list was particularly enriched with 49 ribo- some family genes (19.6%) and 21 metabolism-related genes (8.4%) (Figure 3B). The gene expression changes of selected genes associated with apoptosis and myeloid dif- ferentiation were confirmed by qRT-PCR analysis (Figure
A
B
3C). Single-sample gene set enrichment analysis showed significant enrichment of “myeloid differentiation_up”, “hematopoietic stem cell_down”, “targets of HoxA9 and Meis1_down” signatures, and suppression of “pyrimidine ribonucleoside triphosphate metabolic process” (Figure 3D). These signatures were aligned with the observed effects of ASLAN003. The gene ontology term analysis revealed that upregulated genes were involved in cellular response to ”neutrophil degranulation”, “neutrophil medi- ated immunity”, “positive regulation of caspase activity”, “positive regulation of apoptosis”, “regulation of extrinsic
C
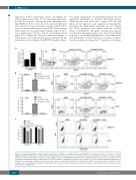
Figure 2. Comparing ASLAN003 versus brequinar and the effect of uridine on cell differentiation by ASLAN003. (A) Comparison between the effects of 100 nM ASLAN003 and 100 nM brequinar on differentiation of MOLM-14 cells. The absolute increase of CD11b+ cells was calculated based on the percentage of CD11b+ cells increased in treated samples compared to control samples exposed to dimethylsulfoxide (DMSO). Representative FACS plots are shown. (B, C) Supplementation of uridine blocks ASLAN003-induced differentiation (B) and cell death (C) in MOLM-14 and THP-1 cells. Leukemic cells were incubated with DMSO, ASLAN003, or ASLAN003 + 50 μM uridine. ASLAN003 was used at a concentration of 100 nM for MOLM-14 cells and 50 nM for THP-1 cells. The percentages of CD11b+ cells (B) or viable cells (C) are illustrated and representative FACS plots are shown. The data were based on triplicate different experiments (mean ± standard deviation). *P<0.05; n.s.: not significant.
2290
haematologica | 2020; 105(9)
