
Page 87 - 2019_03-Haematologica-web
P. 87
NRF2 and Ara-C resistance in MDS
NRF2-mediated Ara-C resistance. To determine whether silencing of NRF2 or DUSP1 compromised the reactive oxygen specis (ROS) levels in MDS cells, we analyzed ROS production by flow cytometry. No significant differ- ence in ROS levels was observed between NRF2 or DUSP1 knockdown MDS cells and control cells (Online Supplementary Figure S7A-D). To further investigate other possible pathways involved in Ara-C resistance, we adjusted the fold change value to 1.1 and the rawp value to 0.05 so that we obtained two larger cohorts of up-reg- ulated genes in high-risk MDS (total 5477 genes) or Ara-C- resistant AML (total 3074 genes). Kyoto Encyclopedia of Genes and Genomes (KEGG) pathway analysis was per- formed on 331 overlapped common genes (Online Supplementary Figure S7E), which revealed potential involvement of genes in a number of pathways (Online Supplementary Figure S7F).
Re-sensitizing MDS cells to Ara-C treatment in vivo by knockdown of NRF2 or DUSP1
To determine the effect of NRF2 and DUSP1 on chemoresistance in vivo, we established xenograft mouse models through intravenously injecting NRF2 shRNA, DUSP1 shRNA, or scramble shRNA SKM-1 cells into NOD/SCID-IL2Rγnull-SGM3 (NSGS) mice. The ratios of human CD45+ cells to mouse CD45+ cells were more than 80% in tumors (Figure 6A) but less than 5% in bone mar- row (Online Supplementary Figure S8A) or peripheral blood (Online Supplementary Figure S8B). However, no significant differences were observed in the survival of transplanted NSGS mice (Online Supplementary Figure S8C-E). In scram- ble shRNA MDS mice, the tumor weight showed a trend to decrease, but did not reach a significant change in the Ara-C treatment group (1.91 g vs. 1.53 g with PBS vs. Ara- C treatment group, respectively; P=0.062) (Figure 6B and C). Treatment of NRF2 or DUSP1 silencing MDS mice
with Ara-C resulted in significantly smaller tumors in the liver (NRF2 silencing MDS mice, 2.30 g vs. 1.77 g with PBS vs. Ara-C treatment group, respectively, P=0.010; DUSP1 silencing MDS mice, 1.84 g vs. 1.41 g, respectively, P=0.001).
Discussion
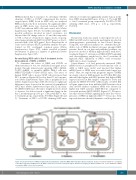
The present study was aimed to investigate the role of NRF2 in MDS and its molecular mechanism involved in chemoresistance, particularly in Ara-C-based therapy. Using IHC and unbiased analysis, we identified the pre- dictive role of NRF2 in clinical outcomes amongst MDS patients. Based on our data and published evidence, we proposed a model of NRF2 in high-risk MDS with Ara-C treatment (Figure 7). Activation of NRF2-DUSP1 signaling and other pathways might lead to Ara-C resistance in high-risk MDS. Inhibition of NRF2 could re-sensitize MDS cells to Ara-C treatment.
Garcia-Manero et al. had previously measured NRF2 mRNA levels in peripheral blood mononuclear cells of AML or MDS cases (n=31) and reported that higher mRNA levels of NRF2 were associated with longer sur- vival.30 Here, we explored the prognostic impact of NRF2 in a larger cohort of MDS patients (n=137). Our IHC data indicated that higher risk MDS patients had higher NRF2 expression levels in BM samples compared to lower risk patients by IPSS-R (P=0.004). GSEA results of CD34+ BM cell gene expressions from published MDS patient cohort data (n=183) further confirmed NRF2 was elevated in higher-risk MDS patients (MDS-EB-1/2) compared to lower-risk patients (MDS-SLD/RS) (Figure 1C). We specu- late that activated NF-κB signaling may drive the overex- pression of NRF2 in high-risk MDS.10,31 It has also been reported that mitochondrial dynamics could regulate neu-
Figure 7. A proposed model of NRF2 in higher-risk myelodysplastic syndrome (MDS) with cytarabine (Ara-C) treatment. (A) Ara-C treatment inhibits the cell viability of the MDS cells with low NRF2 levels. (B) NRF2 confers Ara-C resistance partly through its downstream target gene DUSP1 in MDS cells. (C) The inhibition of NRF2 re-sensitizes MDS cells to Ara-C treatment.
haematologica | 2019; 104(3)
493
