
Page 55 - 2019_03-Haematologica-web
P. 55
SNS driven hypertension enhances hematopoiesis
control Apoe-/- mice. Firstly, no change in vessel diameter or constrictor responses to a high potassium solution was evident. Nor were there differences in basal nitric oxide (NO) levels when the constriction to L-NAME (L-NG- Nitroarginine methyl ester) was examined (Figure 2, A-C). These data suggest that alterations in vascular reactivity are not biased by differences in constrictor responses. Surprisingly, endothelium-dependent NO-mediated relax- ation in response to acetylcholine (ACh) was worse in the Apoe-/- mice when compared to BPH/Apoe-/- mice (Figure 2D). These differences between the strains were endothe- lium independent since there were no differences in the
ABC
D
E
constriction and relaxation response to the NO donor sodium nitroprusside (SNP) in the presence or absence of L-NAME (Figure 2E). To further confirm no decline in vas- cular function in these mice, we examined the abundance of T cells, which have been linked to the pathogenesis of hypertension.28 We observed no differences in aortic T cells between the Apoe-/- and BPH/Apoe-/- mice (Figure 2F). Moreover, there was no difference in the activation state of these CD4+ T cells, as assessed by CD62L expression (MFI; data not shown). These data suggest that the enhanced atherogenesis in the BPH/Apoe-/- mice occurs independently of changes to the endothelium.
FG
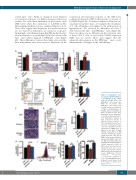
Figure 4. Sympathetic nerv- ous system signalling induces a breakdown of the HSPC niche in the BM. Apoe-/- and BPH/Apoe-/- mice were fed a WTD for 16 weeks with BPH/Apoe-/- mice either treat- ed with or without Propranolol (0.5g/L) in drinking water. A) Plasma NA was quantified by HPLC. B) BM sections were immunostained for sympathet- ic activity as indicated by tyro- sine hydroxylase, imaged at X20; scale bar = 25 mm. C) Systolic blood pressure of mice following 16 weeks treat- ment. D) Osteoblastic lineage cells were quantified by flow cytometry. E) mRNA levels of Runx2 in the BM. F) H&E stained representation of BM vascular morphology, imaged at X10 scale bar = 100 mm. G) BMECs were measured by flow cytometry. H) MMP9 content in the BM extracellular fluid was determined via Zymography. I) CXCR4 expression levels on HSPCs was assessed by flow cytometry from and J) neu- trophil supernatant cultured HSPCs. Data are presented as mean ± SEM where *P<0.05, **P<0.01, ***P<0.001, ****P<0.0001 (Student’s t- test or One-Way ANOVA). A) n= 8, B) n=5, C) n=7, D) n= 7-9, E) n= 5-9, G) n= 7-9, H) 5-9, I) n= 12-15, J) n= 7.
HIJ
haematologica | 2019; 104(3)
461
