
Page 113 - 2019_03-Haematologica-web
P. 113
TP53 subclones in AML
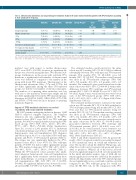
Table 2. Chromosomal aberrations and cooperating gene mutations found in 98 acute myeloid leukemia patients with TP53 mutations according to their variant allele frequency.
Complex karyotype
Marker chromosome -5/5q-
-7/7q-
-17/17p-
N. of losses, median [range]
N. of gains, median [range]
N. of cooperating mutations,
median [range]
VAF<20%
7 (50.0%)
4 (28.6%) 7 (38.9%) 4 (22.2%) 1 (5.6%) 1.0 [0.0-8.0] 1.0 [0.0-6.0]
1.0 [0.0-4.0]
VAF 20%-40%
14 (87.5%)
11 (73.3%) 8 (42.1%) 6 (31.6%) 4 (21.1%) 4.0 [0.0-13.0] 4.5 [0.0-9.0]
0.0 [0.0-3.0]
VAF>40%
46 (85.2%)
34 (64.2%) 31 (50.8%) 15 (24.6%) 16 (26.2%) 5.0 [0.0-13.0] 3.0 [0.0-9.0]
1.0 [0.0-5.0]
Overall P-value*
0.019
0.030 0.625 0.799 0.201 0.028 0.050
0.255
Post-hoc tests <20% <20%
vs. vs. 20%-40% >40%
0.046 0.009
0.027 0.031
0.056 0.008
20%-40% vs. >40%
1.000
0.758
0.806
* Post-hoc tests were only performed if the overall test was significant at the 0.05 significance level.Due to multiple group comparisons in the post-hoc tests,a P-value of <0.017 was considered statistically significant therein. (a) With respect to marker chromosomes, data refer to a total of 82 analyzed, TP53 mutated cases (VAF <20%, n=14; 20%-40%, n=15; >40%, n=53).(b) The number (N.) of losses, gains and cooperating mutations refers to the total number of specific aberrations observed per sample.
mutated cases with respect to marker chromosomes (2.9% versus 59.8%; P<0.001), however, no significant dif- ference was observed among the three TP53-mutated sub- groups. Furthermore, in the group with subclonal TP53 mutations, a significantly lower number of chromosomal losses was detected as compared to the number in the group with clonal TP53 mutations. The frequency of the chromosomal aberrations -5/5q-, -7/7q- and -17/17p- did not differ significantly among the three TP53-mutated groups, nor did the total number of chromosomal gains. The number of cooperating driver mutations was low with zero to five mutations detected per sample and did not differ significantly between the TP53-mutated groups. Mutations in DNMT3A (14/98), NRAS (8/98), FLT3 (7/98) and PTPN11 (7/98) were the most frequent cooperating mutations (Figure 2).
Impact of TP53-mutated subclones on survival of patients with acute myeloid leukemia
Of 1,537 patients undergoing induction therapy, 1,268 (82.5%) achieved complete remission. The complete remission rate was significantly inferior in the TP53- mutated cohort (48.0% versus 84.9% for TP53 wild-type patients, P<0.001) but equally distributed among the VAF- based groups (TP53 VAF >40%, 42.6%; 20%-40%, 57.9%; <20%, 55.6%; P=0.424) (Online Supplementary Figure S1). A total of 1,031 patients (67.1%) underwent consolidation therapy and of those, 439 (42.6%) received hematopoietic stem cell transplantation (351 allogeneic and 88 autologous; 42.1% of consolidated TP53 wild-type patients and 57.6% of TP53-mutated patients) (Table 1). The relapse rate was significantly higher in the TP53- mutated cohort (68.1% versus 47.8% for TP53 wild-type patients, P=0.007) but did not differ significantly among the TP53-mutated subgroups (TP53 VAF >40%, 69.2%; 20%-40%, 81.8%; <20%, 50.0%; P=0.336) (Table 1). Within the TP53-mutated cohort, patients who under- went allogeneic hematopoietic stem cell transplantation had a significantly better event-free survival than those given chemotherapy or autologous hematopoietic stem cell transplantation [HR, 0.25 (95% CI: 0.11-0.58); P=0.001]. No significant difference was observed for over- all survival [HR, 0.47 (95% CI: 0.22-1.01); P=0.054].
The estimated median overall survival for the entire cohort was 28.1 months (95% CI: 24.3-33.5) but differed substantially between TP53 wild-type and TP53-mutated patients [33.6 months (95% CI: 28.4-45.0) versus 6.5 months (95% CI: 5.0-8.2)]. The median overall survival was short in all TP53-mutated subgroups (TP53 VAF >40%, 5.8 months; 20%-40%, 6.9 months; <20%, 6.9 months). The estimated 3-year overall survival rate for the entire cohort was 46.5% (95% CI: 44.0-49.1) with notable differences between TP53 wild-type and TP53-mutated patients [49.1% (95% CI: 46.5-51.8) versus 8.3% (95% CI: 4.3-16.2)]. Again, 3-year overall survival rates were low in each of the TP53-mutated groups (TP53 VAF >40%, 11.5%; 20%-40%, 5.3%; <20%, 0%) (Figure 3A,B, Online Supplementary Table S2).
The estimated median event-free survival for the entire cohort was 15.0 months (95% CI: 13.6-16.5) with that for TP53 wild-type patients being 16.5 months (95% CI: 15.0- 18.2) and that for TP53-mutated patients being 5.7 months (95% CI: 4.3-7.4). The median event-free survival was short in all TP53-mutated subgroups (TP53 VAF >40%, 5.2 months; 20%-40%, 6.9 months; <20%, 6.5 months). The estimated 3-year event-free survival rate for the entire cohort was 36.3% (95% CI: 33.9-38.8) with a pronounced difference between TP53 wild-type and TP53-mutated patients [38.3% (35.9-40.9) versus 6.3% (2.9-13.6)]. As for overall survival, 3-year event-free sur- vival rates were low in all TP53-mutated subgroups (TP53 VAF >40%, 9.8%; 20%-40%, 0%; <20%, 0%).(Figure 4A,B, Online Supplementary Table S3).
Table 3 and Online Supplementary Table S4 present the results of the Cox regression analyses assessing the impact of TP53 mutational status on overall and event-free sur- vival. The models contain the different VAF groups, age, white blood cell count, cytogenetic risk group and type of AML as predictors. Whereas all of the factors assessed showed a significant impact on both outcome parameters in the initial univariable analysis, type of AML did not remain significant for event-free survival in the multivari- able model. Importantly, each of the TP53-mutated groups showed significantly worse overall and event-free survival compared to the TP53 wild-type group. For overall sur- vival, the HR (95% CI), for the comparison with TP53
haematologica | 2019; 104(3)
519
