
Page 112 - 2019_03-Haematologica-web
P. 112
K.T. Prochazka et al.
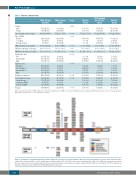
Table 1. Patients’ characteristics.
Gender male female
Age (median, years) [range]
Type of AML
de novo
secondary therapy-related
WBC (median, 109/L) [range] PB blasts (median, %) [range] BM blasts (median, %) [range]
Cytogenetic risk low
intermediate high
ELN 2010 risk favorable intermediate-1 intermediate-2 high
Complete remission
Consolidation therapy chemotherapy autologous HSCT allogeneic HSCT
Relapse
TP53 wild-type (N=1439)
758 (52.7%) 681 (47.3%)
49.4 [18.3-84.5]
1326 (92.1%) 57 (4.0%) 56 (3.9%)
15.6 [0.2-532.7] 38.0 [0.0-100.0] 76.0 [0.0-100.0]
202 (15.1%) 930 (69.9%) 199 (15.0%)
421 (33.2%) 402 (31.7%) 258 (20.4%) 186 (14.7%)
1221 (84.9%)
998 (69.4%) 578 (57.9%) 87 (8.7%) 333 (33.4%)
584 (47.8%)
TP53 mutated (N=98)
60 (61.2%) 38 (38.8%)
57.4 [20.0-78.8]
82 (83.7%) 4 (4.1%) 12 (12.2%)
4.8 [0.5-145.4]
19.0 [0.0-96.0] 60.0 [14.0-100.0]
2 (2.4%) 11 (13.1%) 71 (84.5%)
2 (2.4%) 7 (8.3%) 4 (4.8%) 71 (84.5%)
47 (48.0%)
33 (33.7%) 14 (42.4%) 1 (3.0%) 18 (54.5%)
32 (68.1%)
P-value 0.116
<0.001 0.002
<0.001 0.001 0.002 <0.001
<0.001
<0.001
<0.001
0.007
VAF<20% (N=18)
9 (50.0%) 9 (50.0%)
58.1 [20.0-73.3]
18 (100%) 0 (0.0%) 0 (0.0%)
3.0 [1.0-133.2] 5.0 [0.0-96.0] 46.0 [18.0-100.0]
0 (0.0%) 6 (42.9%) 8 (57.1%)
1 (7.1%) 4 (28.6%) 1 (7.1%) 8 (57.1%)
10 (55.6%)
6 (33.3%) 3 (50.0%) 0 (0.0%) 3 (50.0%)
5 (50.0%)
TP53 mutated VAF 20%-40% (N=19)
14 (73.7%) 5 (26.3%)
56.9 [28.4-76.4]
14 (73.7%) 1 (5.3%) 4 (21.1%)
3.3 [0.5-43.3] 11.0 [0.0-83.0] 60.0 [14.0-90.0]
1 (6.2%)
0 (0.0%) 15 (93.8%)
1 (6.2%) 0 (0.0%) 0 (0.0%) 15 (93.8%)
11 (57.9%)
8 (42.1%) 4 (50.0%) 1 (12.5%) 3 (37.5%)
9 (81.8%)
VAF>40% (N=61)
37 (60.7%) 24 (39.3%)
56.9 [28.2-78.8]
50 (82.0%) 3 (4.9%) 8 (13.1%)
7.7 [1.0-145.4] 31.0 [0.0-92.0] 69.0 [20.0-95.0]
1 (1.9%)
5 (9.3%) 48 (88.9%)
0 (0.0%) 3 (5.6%) 3 (5.6%) 48 (88.9%)
26 (42.6%)
19 (31.1%) 7 (36.8%) 0 (0.0%) 12 (63.2%)
18 (69.2%)
VAF: variant allele frequency; WBC: white blood cells; PB: peripheral blood; BM: bone marrow; ELN: European LeukemiaNet; HSCT: hematopoietic stem cell transplantation. Numbers presented are N (%) if not otherwise specified.
Figure 1. Distribution of 108 TP53 mutations found in diagnostic specimens of 98/1537 patients with acute myeloid leukemia. Top panel: TP53 mutations with a variant allele frequency (VAF) of >40%; middle panel: mutations with a VAF of 20%-40%; lower panel: mutations with a VAF <20%. Missense mutations are marked in black, nonsense in red, insertions/deletions in blue and essential splice site mutations in purple. Despite different VAF, the vast majority of TP53 mutations are missense mutations located within the DNA binding domain of the gene.
518
haematologica | 2019; 104(3)
