
Page 103 - 2019_03-Haematologica-web
P. 103
Atypical TG2 expression activates the NF-κB pathway
A
B
C
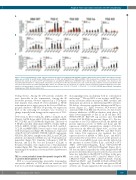
Figure 3. Tissue transglutaminase (TG2) expression drives both expression of NCF2 and GP91PHOX respiratory burst oxidase genes and the generation of reactive oxygen species (ROS). (A and B) Relative mRNA expressions of NCF2 and GP91PHOX upon ATRA and ATRA + NC9 treatment over 11 days were determined at the indicated time points by real-time Q-PCR and normalized to cyclophilin-D mRNA levels in NB4-WT, TG2-C, TG2-KD, TG2-ha, and TG2-KO cells. Results are the mean±Standard Deviation of 3 independent experiments. (C) Production of ROS was determined for each cell line by using a luminescence-based method in tripli- cates (n=5) and reported as relative light units (RLU). Values are normalized to 100 mg protein of cell lysate content, respectively. Statistical significance was deter- mined via two-way analysis of variance (ANOVA; Bonferroni post-hoc test; *P<0.05, **P<0.01, ***P<0.005 ****P<0.001). GAPDH: glyceraldehyde 3-phosphate dehydrogenase; ATRA: all-trans retinoic acid.
Testing Service. Among the 200 proteins available, 50 were detectable in the supernatants. Among the 50 detectable proteins, 44 were expressed in a TG2-depen- dent manner, from which 18 were identified as NF-κB transcription-factor target genes in the Boston NF-κB tar- get gene database.28 Of these 18 proteins, the expression level of the following 10 cytokines was observed to change in parallel with changes in the expression of TG2 : TNFα, I-309 (CCL-1), IP-10 (CXCL10), MIP-3α (CCL20), IL-10, ICAM-1, MCSF, IL-1ra, MDC (CCL22), and PAI-1 in NB4- WT, TG2-KD, and TG2-KO cells (Figure 5A). The levels of 8 NF-κB-controlled chemokines [MCP-1 (CCL2), MIP-1a (CCL3), MIP-1b (CCL4), cytokines IL-1b, IL-8, and IL-9, CCL-28, and OPN (SPP1)] were found to vary in parallel with TG2 expression (Figure 5B). Furthermore, expression of MCP-3 (CCL7), MCSF R, TNF RII, GDF-15, angiogenin, VEGF R1, PECAM-1, lymphotactin (XCL1), and CXCL16, which do not depend on NF-κB, was also TG2 expression- dependent (Figure 5C). Similarly, Cathepsin S, TNF RI, Resistin, and IL-2 Rb, but not Eotaxin-3 (CCL26) or Eotaxin-2 (CCL24), were expressed in a TG2-dependent manner (Figure 5D). The supernatant concentration of the remaining 16 biomarkers is shown in Online Supplementary Figure S6.
TG2 is a new potential chemotherapeutic target in APL to prevent development of DS
NC9 is a novel penetrating, irreversible transamidase site-specific inhibitor of TG2, which can transform TG2 from its closed/folded (signaling) conformation to its open
(non-signaling) form, modulating both its conformation and activity.29,30 We used NC9 to test its effect on NBT-pos- itivity, cell-surface adhesion receptors, ROS, cytokine, and chemokine production in differentiating NB4 cell lines. We did not observe any significant difference in NBT-pos- itivity (Figure 1C, right) between NC9-treated and -untreated NB4 TG2-KO cells. However, we did observe effective inhibition of ROS production, with almost 10 times lower magnitude at day 11 in all cell lines (WT 8884.00±759.29 RLU/100 mg protein and TG2-KO 133.66±17.67 RLU/100 mg protein) (Figure 3C). We also found that at low TG2 expression levels, the mRNA and protein expression levels of TNFα and IL-1b and the expression of MCP-1 remained low, similar to TG2-defi- cient states in the NB4 cells (Figure 4A-C, red bars and lines). In the ATRA-treated NB4-WT and NB4 TG2-C cells, where TG2 expression was maximal, the total expression levels of mRNA of TNFα, IL-1b , and MCP-1 were reduced by at least 50% or more in the presence of NC9. The lower mRNA levels were directly reflected in the amounts of secreted TNFα, IL-1b , and MCP-1 (WT; TNFα 1133.01±214.01pg/mL, IL-1b 3467.16±310.59 pg/mL, and MCP-1 1220.14±53.09pg/mL) (Figure 4A-C, red bars and lines). In parallel, the stably integrated NF-κB promoter-driven luciferase reporter activity was at least 15 times less inducible in the NB4-WT cell lines in the pres- ence of the TG2 inhibitor (WT: 1.12x10⁴±7.48x10³, TG2-C 1.58x10⁴±9.73x10³, TG2-KD 6.15x10²±3.40x10², TG2-ha 2.54x10³±2.05x10³, and TG2-KO 4.15x10²±1.58x10²/100 mg protein) (Figure 4D). The reduced endogenous NF-κB activities also became apparent in the amounts of secreted
haematologica | 2019; 104(3)
509
