
Page 102 - 2019_03-Haematologica-web
P. 102
K. Jambrovics et al.
A
B
C
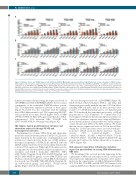
Figure 2. All-trans retinoic acid (ATRA) induces both CD11b and CD11c b2 integrin expression and their high-affinity state on the cell surface of NB4 cell lines. FACS analysis of (A) cell-surface expression of L-selectin, differentiation marker (B) CD11b and (C) CD11c in 1 mM ATRA, 1 mM ATRA + 30 mM NC9, or after 20 minutes stimulation of 10 nM PMA-treated NB4-WT, TG2-C, NB4 TG2-KD, TG2-ha, and TG2-KO cells, respectively, at the indicated days. Measurements were conducted in triplicates, and values were validated via Flowing software. Graphs show the representation of the mean±Standard Deviation fluorescent intensity (MFI) values, in parallel. MFI values were calculated based on each treatment’s respective isotype control (n=9). Statistical analysis was performed via two-way analysis of variance (ANOVA; Bonferroni post-hoc test; *P<0.05, **P<0.01, ***P<0.005 ****P<0.001).
further investigated by measuring the expression levels of GP91PHOX and NCF-2/P67PHOX mRNA, the two major components of the neutrophil NADPH-oxidase system. The TG2-dependent expression pattern of these genes (Figure 3A and B) was also consistent with the findings that ATRA-differentiated total TG2 expressing NB4-WT cells produced more than 20-fold higher levels of ROS (70996.33±9034.96: RLU/100 μg protein) than the ATRA- differentiated TG2 deficient NB4 TG2-KO cells (2767.33±205.90 RLU/ 100 mg protein) (Figure 3C).
Because the expression levels of GP91PHOX (Figure 3B), MCP-1/CCL2, MDC/CCL22,21 TNF-α, and IL1b had changed proportionally with the amount of TG2 in differ- entiating NB4 cell lines, and as all these proteins were found to be NF-κB-dependent genes, we hypothesized that TG2 mediated the transcriptional activity of NF-κB proportional to TG2 abundance. To confirm that TG2 level supports NF-κB-mediated transcriptional activity, we carried out a luciferase reporter assay using an NF-κB pro- moter-driven luciferase construct that was stably integrat- ed into the genomic DNA of the NB4 cell lines. We found that the various expression levels of TG2 in the cell lines during the 11-day time frame were associated with pro- portionate NF-κB promoter-driven luciferase reporter activity (WT: 1.41x10⁵±3.14x10⁴, TG2-C 1.29x10⁵±1.46x10⁴, TG2-KD 2.40x10⁴±7.35x10³, TG2-ha 1.39x10⁴±3.63x10³, TG2-KO 5.22x10²±1.44x10²/100 mg protein) and could not be further enhanced by exogenous TNF-α (Figure 4D).
TG2 expression level drives inflammatory cytokine expression quantitatively in resting ATRA-differentiated NB4cells
We determined the secreted proteins appearing in the supernatant of NB4 cells at normal, reduced, or abrogated TG2 expression. Inflammatory biomarkers were quanti- fied from the supernatants of ATRA-differentiated NB4- WT, TG2-KD, TG2-KO, and NB4-WT NC9-treated cells using the ELISA-based RayBiotech 200 Human Biomarker
TG2 induces typical proinflammatory cytokines and chemokine expression through NF-κB and transcriptional activation
Proinflammatory cytokine TNFα, IL-1b, and chemokine monocyte chemoattractant protein-1 (MCP-1/CCL2) have many functions in the progression of inflammation and activation of other leukocytes. In the case of NB4 cell lines, the expression patterns of TNFα, IL-1b, and MCP-1 in both mRNA and protein levels showed very similar trends in the context of TG2 expression. While high TG2 expression was accompanied by elevated mRNA and protein expression of cytokines and MCP-1 chemokine (NB4-WT; TNFα 3120.74±321.39 pg/mL, IL-1b 6721.27±510.05 pg/mL, and MCP-1 2053.95±55.53 pg/mL) at low (NB4 TG2-KD and TG2-ha) or deficient expression of TG2-KO, both remained low in each case (TG2-KO; TNFα 658.28±36.33 pg/mL, IL- 1b 818.00±10.02 pg/mL, and MCP-1, 576.16±133.86 pg/mL) (Figure 4A1-C2, black bars and lines).
508
haematologica | 2019; 104(3)
