
Page 79 - Haematologica Vol. 110 - January 2025
P. 79
ARTICLE - HCT in elderly AML
morbidity N=4; withdrawal N=3; unavailable donor N=3)
and 16.7% in the non-HCT arm (relapse N=2; morbidity N=2; withdrawal N=3; Figure 1). In total, 66 of the 83 patients in the HCT arm finally received HCT. In the non-HCT arm 35 of the 42 patients local non-HCT therapy. In those trans- planted, mean time from diagnosis to transplant was 4.5 months, with 62 of 66 (94%) within less than 6 months (Online Supplementary Figure S3B).
The median follow-up time of surviving patients was 62 months. Figure 2A shows LFS in the ITT analysis. Kaplan Meier curves cross within the first year. Five-year LFS rates were 28.8% (95% confidence interval [CI]: 20.4-40.6) in the
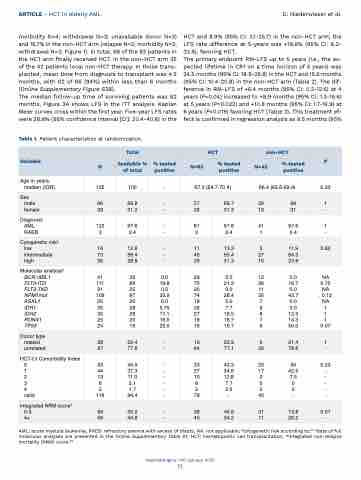
Table 1. Patient characteristics at randomization.
D. Niederwieser et al.
HCT and 8.9% (95% CI: 3.1-25.7) in the non-HCT arm; the LFS rate difference at 5-years was +19.9% (95% CI: 6.2- 33.6), favoring HCT.
The primary endpoint RM-LFS up to 5 years (i.e., the ex- pected lifetime in CR1 on a time horizon of 5 years) was 24.5 months (95% CI: 18.9-29.8) in the HCT and 15.6 months (95% CI: 10.4-20.8) in the non-HCT arm (Table 2). The dif- ference in RM-LFS of +6.4 months (95% CI: 0.2-12.6) at 4 years (P=0.04) increased to +8.9 months (95% CI: 1.3-16.6) at 5 years (P=0.022) and +10.8 months (95% CI: 1.7-19.9) at 6 years (P=0.019) favoring HCT (Table 3). This treatment ef- fect is confirmed in regression analysis as 9.5 months (95%
Variable
Total
HCT
non-HCT
P
N
Available % of total
% tested positive
N=83
% tested positive
N=42
% tested positive
Age in years, median (IQR)
125
100
-
67.3 (64.7-70.4)
66.4 (63.6-69.9)
0.23
Sex male
female
86 39
68.8 31.2
-
57 26
68.7 31.3
29 13
69 31
1-
Diagnosis AML
RAEB
122 3
97.6 2.4
-
81 2
97.6 2.4
41 1
97.6 2.4
1-
Cytogenetic risk§ low
intermediate high
16 73 36
12.8 58.4 28.8
-
11 46 26
13.3 55.4 31.3
5 27 10
11.9 64.3 23.8
0.62
Molecular analysis#
BCR::ABL1 FLT3-ITD FLT3-TKD NPM1mut ASXL1 IDH1
IDH2 RUNX1 TP53
41 111 31 109 25 35 35 25 24
33
89
25
87
20
28
28
20
19
0.0 19.8 0.0 33.9 0.0 5.79 17.1 16.0 25.0
29
75
20
74
18
26
27
18
18
0.0 21.3 0.0 28.4 0.0 7.7 18.5 16.7 16.7
12 36 11 35
79876
0.0 16.7 0.0 45.7 0.0 0.0 12.5 14.3 50.0
NA 0.75 NA . 0.12 NA
1 0.07
Donor type related
unrelated
28 97
22.4 77.6
-
19 64
22.9 77.1
9 33
21.4 78.6
1-
HCT-CI Comorbidity Index
01234valid
53 44 13
62 118
44.9 37.3 11.0 5.1 1.7 94.4
-
33 27 10
62 78
42.3 34.6 12.8 7.7 2.6 -
20 17
30 40
50 42.5 7.5
0-
0.23 -
Integrated NRM score* 0-3
4+
69 56
55.2 44.8
-
38 45
45.8 54.2
31 11
73.8 26.2
0.01 -
AML: acute myeloid leukemia; RAEB: refractory anemia with excess of blasts; NA: not applicable; §cytogenetic risk according to;20 #data of full molecular analyses are presented in the Online Supplementary Table S1; HCT: hematopoetic cell transplantation; *integrated non-relapse mortality (NRM) score.28
Haematologica | 110 January 2025
71
