
Page 81 - Haematologica Vol. 110 - January 2025
P. 81
ARTICLE - HCT in elderly AML
D. Niederwieser et al.
were too small to allow for a meaningful analysis (Online Supplementary Table S6). The distributions of FLT3-internal tandem duplication (ITD)-positive patients were neither different in the HCT and non-HCT treatment groups (21.3% vs. 16.7%; P=0.75; Table 1), respectively. TP53 mutant was present in six of 24 patients tested and distributed equally between the two arms (3 in each).
LFS events were either AML relapse, NRM or initiation of anti-leukemic treatment. Cumulative incidence curves of relapse with NRM as a competing risk show a potent anti-leukemic effect after HCT treatment (Figure 2C). Al- most all patients in the non-HCT arm relapsed early with a 5-year RI of 91.1% (95% CI: 80.7-100.0). In contrast, RI in the HCT was 37.8% (95% CI: 27.2-48.4) at 5 years (hazard ratio [HR]=3.1; 95% CI: 1.93-4.98; P<0.0001).
On the other hand, NRM was exclusively observed in the HCT arm with a 5-year NRM cumulative incidence (with RI as a competing risk) of 33.4% (95% CI: 23.0-43.9) (Figure 2D). Cumulative incidence of NRM, broken down by the inte- grated NRM score28 was 25.0% (95% CI: 6.9-43.1) in patients with lower score (0-3) versus 45.7% (95% CI: 30.2-61.2) in higher scores (4+) (Online Supplementary Figure S4). Relapses were the predominant cause of death in both treatment groups, i.e., 50.9% in the HCT and 100% in the non-HCT group. Infections (22.8%; bacterial 19.3% and viral 3.5%) and GVHD (10.5%; Online Supplementary Table S7) were the most frequent cause of death after relapse in the HCT arm. Cumulative incidence of acute GVHD grade 3-4 was noted in 13.1% and chronic GVHD in 33.5% at 5 years
(Online Supplementary Figures S5, S6).
OS curves cross at about 20 months (Figure 2B). Five-year OS rates were 31.3% (95% CI: 22.6-43.2) in the HCT arm and 27.1% (95% CI: 15.9-46.4) in the non-HCT arm (not signif- icant). The secondary outcome RM-OS up to 5 years (i.e., the expected lifetime on a time horizon of 5 years) is 27.8 months (95% CI: 22.2-33.0) in the HCT and 28.6 months (95% CI: 21.7-35.3) in the non-HCT arm (P=0.85; Online Supplementary Figure S8B). Thus, the long-term RM-LFS benefit does not translate into a benefit in the secondary endpoint RM-OS - at least not within the study period. Of note, 19 of 34 (56%) non-HCT patients with an AML relapse received HCT in CR2 as part of second line treatment. OS of patients after relapse in the non-HCT arm according to HCT and non-HCT after relapse is given in Online Supple- mentary Figure S9 and results of patients in the observation arm in Online Supplementary Figure S10.
Discussion
HCT has become a commonly applied treatment modality in younger and middle-aged adults with AML, particularly for those patients with a comparatively high prognostic risk of recurrence of disease following chemotherapy.27,29 The incidence of AML increases with age and older pa- tients generally have an unfavorable outcome even in so called low or intermediate genetic risk, making them potential candidates for HCT.2,20 The age-depended risk of
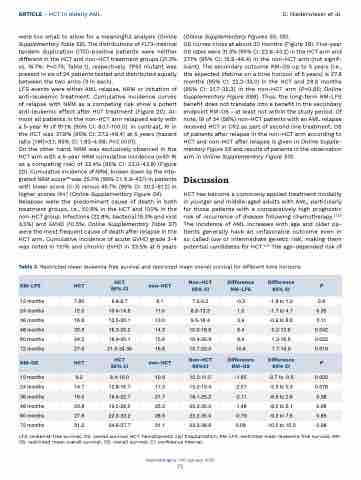
Table 3. Restricted mean leukemia-free survival and restricted mean overall survival for different time horizons.
RM-LFS
HCT
HCT 95% CI
non-HCT
Non-HCT 95% CI
Difference RM-LFS
Difference 95% CI
P
12 months
7.80
6.8-8.7
8.1
7.0-9.2
-0.3
-1.8 to 1.2
0.8
24 months
12.5
10.4-14.6
11.0
8.6-13.3
1.5
-1.7 to 4.7
0.35
36 months
16.8
13.5-20.1
13.0
9.5-16.4
3.9
-0.9 to 8.6
0.11
48 months
20.8
16.3-25.2
14.3
10.0-18.6
6.4
0.2-12.6
0.042
60 months
24.5
18.9-30.1
15.6
10.4-20.8
8.9
1.3-16.6
0.022
72 months
27.6
21.0-34.39
16.8
10.7-23.0
10.8
1.7-19.9
0.019
RM-OS
HCT
HCT 95% CI
non-HCT
Non-HCT 95%CI
Difference RM-OS
Difference 95% CI
P
12 months
9.2
8.4-10.0
10.9
10.2-11.5
-1.65
-2.7 to -0.6
0.002
24 months
14.7
12.8-16.7
17.3
15.2-19.4
-2.57
-5.5 to 0.3
0.078
36 months
19.5
16.4-22.7
21.7
18.1-25.2
-2.11
-6.9 to 2.6
0.38
48 months
23.8
19.5-28.0
25.2
20.3-30.2
-1.48
-8.0 to 5.1
0.66
60 months
27.8
22.3-33.2
28.6
22.2-35.0
-0.79
-9.2 to 7.6
0.85
72 months
31.2
24.6-37.7
31.1
23.3-38.8
0.09
-10.0 to 10.2
0.98
LFS: leukemia-free survival; OS: overall survival; HCT: hematopoetic cell trasplantation; RM-LFS: restricted mean leukemia-free survival; RM- OS: restricted mean overall survival; OS: overall survival; CI: confidence interval.
Haematologica | 110 January 2025
73
