
Page 256 - Haematologica Vol. 110 - January 2025
P. 256
LETTER TO THE EDITOR A
BC
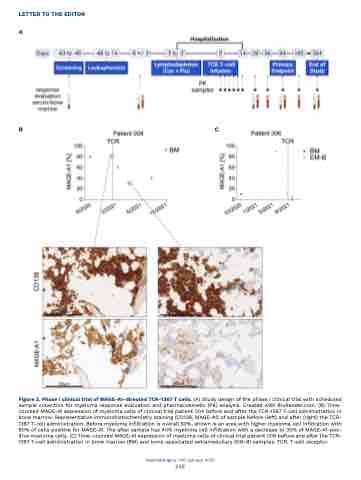
Figure 3. Phase I clinical trial of MAGE-A1-directed TCR-1367 T cells. (A) Study design of the phase I clinical trial with scheduled sample collection for myeloma response evaluation and pharmacokinetic (PK) analysis. Created with BioRender.com. (B) Time- coursed MAGE-A1 expression of myeloma cells of clinical trial patient 004 before and after the TCR-1367 T-cell administration in bone marrow. Representative immunohistochemistry staining (CD138, MAGE-A1) of sample before (left) and after (right) the TCR- 1367 T-cell administration. Before myeloma infiltration is overall 60%, shown is an area with higher myeloma cell infiltration with 80% of cells positive for MAGE-A1. The after sample has 40% myeloma cell infiltration with a decrease to 30% of MAGE-A1-pos- itive myeloma cells. (C) Time-coursed MAGE-A1 expression of myeloma cells of clinical trial patient 006 before and after the TCR- 1367 T-cell administration in bone marrow (BM) and bone-associated extramedullary (EM-B) samples. TCR: T-cell receptor.
Haematologica | 110 January 2025
248
