
Page 255 - Haematologica Vol. 110 - January 2025
P. 255
LETTER TO THE EDITOR A
B
CD
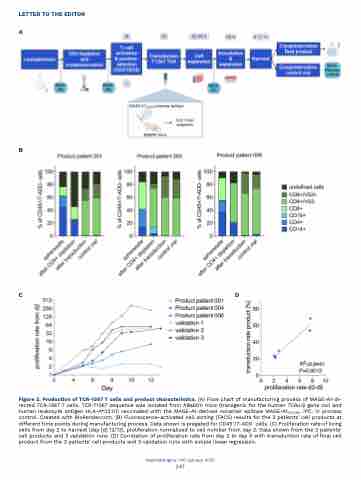
Figure 2. Production of TCR-1367 T cells and product characteristics. (A) Flow chart of manufacturing process of MAGE-A1-di- rected TCR-1367 T cells. TCR-T1367 sequence was isolated from ABabDII mice (transgenic for the human TCRa/β gene loci and human leukocyte antigen HLA-A*02:01) vaccinated with the MAGE-A1-derived nonamer epitope MAGE-A1278-286. IPC: in process control. Created with BioRender.com. (B) Fluorescence-activated cell sorting (FACS) results for the 3 patients’ cell products at different time points during manufacturing process. Data shown is pregated for CD45+/7-ADD- cells. (C) Proliferation rate of living cells from day 2 to harvest (day [d] 12/13), proliferation normalized to cell number from day 2. Data shown from the 3 patients’ cell products and 3 validation runs. (D) Correlation of proliferation rate from day 2 to day 5 with transduction rate of final cell product from the 3 patients’ cell products and 3 validation runs with simple linear regression.
Haematologica | 110 January 2025
247
