


Page 215 - Haematologica Vol. 110 - January 2025
P. 215
LETTER TO THE EDITOR
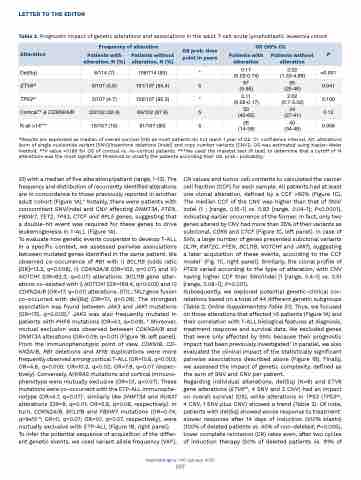
Table 2. Prognostic impact of genetic alterations and associations in the adult T-cell acute lymphoblastic leukemia cohort.
 Alteration
 Frequency of alteration
 OS prob. time point in years
 OS (95% CI)
 P
 Patients with alteration, N (%)
 Patients without alteration, N (%)
 Patients with alteration
 Patients without alteration
 Del(5q)
 8/114 (7)
 106/114 (93)
 *
0.17 (0.02-0.74)
 2.02 (1.53-4.88)
  <0.001
 ETV6alt
  6/107 (5.6)
  101/107 (94.4)
  5
 67 (5-95)
  35 (25-46)
   0.041
 TP53alt
5/107 (4.7)
102/107 (95.3)
*
0.11 (0.05-0.17)
2.02 (0.7-3.32)
0.100
 Cortical** & CDKN2A/B
 33/102 (32.4)
 69/102 (67.6)
 5
50 (40-60)
 34 (27-41)
  0.12
 N alt >14***
  16/107 (15)
  91/107 (85)
  5
 26 (14-38)
  40 (34-46)
   0.006
   *Results are expressed as median of overall survival (OS) as most patients do not reach 1 year of OS. CI: confidence interval. Alt: alterations (sum of single nucleotide variant [SNV]/insertions deletions [indel] and copy number variants [CNV]). OS was estimated using Kaplan-Meier method. **P value =0.189 for OS of cortical vs. no-cortical patients. ***We used the maxstat test (R test) to determine that a cutoff of 14 alterations was the most significant threshold to stratify the patients according their OS. prob.: probabilty.
S1) with a median of five alterations/patient (range, 1-13). The frequency and distribution of recurrently identified alterations are in concordance to those previously reported in another adult cohort (Figure 1A).4 Notably, there were patients with concomitant SNV/indel and CNV affecting DNMT3A, PTEN, FBXW7, TET2, TP53, CTCF and RPL5 genes, suggesting that a double-hit event was required for these genes to drive leukemogenesis in T-ALL (Figure 1A).
To evaluate how genetic events cooperate to develop T-ALL in a specific context, we assessed pairwise associations between mutated genes identified in the same patient. We observed co-occurrence of RB1 with i) BCL11B (odds ratio [OR]=13.3, q=0.008), ii) CDKN2A/B (OR=102, q=0.07) and iii) NOTCH1 (OR=92.3, q=0.07) alterations. BCL11B gene alter- ations co-existed with i) NOTCH1 (OR=169.4, q=0.003) and ii) CDKN2A/B (OR=17, q=0.01) alterations. STIL::TAL1 gene fusion co-occurred with del(6q) (OR=7.1, q=0.09). The strongest association was found between JAK3 and JAK1 mutations (OR=115, q=0.003).5 JAK3 was also frequently mutated in patients with PHF6 mutations (OR=5.1, q=0.09). 6 Moreover, mutual exclusion was observed between CDKN2A/B and DNMT3A alterations (OR=0.09, q=0.01) (Figure 1B, left panel). From the immunophenotypic point of view, CDKN1B, CD- KN2A/B, RB1 deletions and MYB duplications were more frequently observed among cortical T-ALL (OR=10.6, q=0.003; OR=4.8, q=0.005; OR=10.3, q=0.02; OR=7.8, q=0.07 respec- tively). Conversely, N/KRAS mutations and cortical immuno- phenotype were mutually exclusive (OR=0.1, q=0.07). These mutations were co-occurrent with the ETP-ALL immunophe- notype (OR=4.7, q=0.07)1, similarly like DNMT3A and RUNX1 alterations (OR=8, q=0.01; OR=5.6, q=0.06, respectively). In turn, CDKN2A/B, BCL11B and FBXW7 mutations (OR=0.04, q=9x10⁻⁶; OR=0, q=0.07; OR=0.1, q=0.07, respectively), were mutually exclusive with ETP-ALL (Figure 1B, right panel). To infer the potential sequence of acquisition of the differ- ent genetic events, we used variant allele frequency (VAF),
CN values and tumor cell contents to calculated the cancer cell fraction (CCF) for each sample. All patients had at least one clonal alteration, defined by a CCF >50% (Figure 1C). The median CCF of the CNV was higher than that of SNV/ indel (1 ; [range, 0.15-1] vs. 0.83 [range, 0.04-1]; P<0.0001), indicating earlier occurrence of the former. In fact, only two genes altered by CNV had more than 35% of their variants as subclonal, CDK6 and CTCF (Figure 1C, left panel). In case of SNV, a large number of genes presented subclonal variants (IL7R, KMT2C, PTEN, BCL11B, NOTCH1 and JAK1), suggesting a later acquisition of these events, according to the CCF model7 (Fig. 1C, right panel). Similarly, the clonal profile of PTEN varied according to the type of alteration, with CNV having higher CCF than SNV/indel (1 [range, 0.4-1] vs. 0.51 [range, 0.08-1]; P=0.001).
Subsequently, we explored potential genetic-clinical cor- relations based on a total of 44 different genetic subgroups (Table 2; Online Supplementary Table S1). Thus, we focused on those alterations that affected >5 patients (Figure 1A) and their correlation with T-ALL biological features at diagnosis, treatment response and survival data. We excluded genes that were only affected by SNV, because their prognostic impact had been previously investigated.1 In parallel, we also evaluated the clinical impact of the statistically significant pairwise associations described above (Figure 1B). Finally, we assessed the impact of genetic complexity, defined as the sum of SNV and CNV per patient.
Regarding individual alterations, del(5q) (N=8) and ETV6 gene alterations (ETV6alt, 4 SNV and 2 CNV) had an impact on overall survival (OS), while alterations in TP53 (TP53alt, 4 CNV, 1 SNV plus CNV) showed a trend (Table 2). Of note, patients with del(5q) showed worse response to treatment: slower response after 14 days of induction (≥10% blasts) (100% of deleted patients vs. 40% of non-deleted; P=0.005), lower complete remission (CR) rates even, after two cycles of induction therapy (50% of deleted patients vs. 91% of
Haematologica | 110 January 2025
207


