


Page 143 - Haematologica Vol. 110 - January 2025
P. 143
ARTICLE - Immune microenvironment in nodal PTCL P. Stephan et al. A
BC
DEF
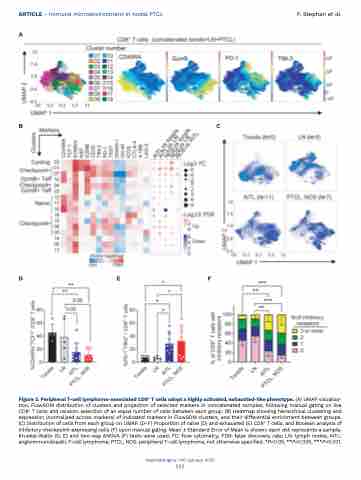
Figure 3. Peripheral T-cell lymphoma-associated CD8+ T cells adopt a highly activated, exhausted-like phenotype. (A) UMAP visualiza- tion, FlowSOM distribution of clusters and projection of selected markers in concatenated samples, following manual gating on live CD8+ T cells and random selection of an equal number of cells between each group. (B) Heatmap showing hierarchical clustering and expression (normalized across markers) of indicated markers in FlowSOM clusters, and their differential enrichment between groups. (C) Distribution of cells from each group on UMAP. (D-F) Proportion of naïve (D) and exhausted (E) CD8+ T cells, and Boolean analysis of inhibitory checkpoint-expressing cells (F) upon manual gating. Mean + Standard Error of Mean is shown; each dot represents a sample. Kruskal-Wallis (D, E) and two-way ANOVA (F) tests were used. FC: flow cytometry; FDR: false discovery rate; LN: lymph nodes; AITL: angioimmunoblastic T-cell lymphoma; PTCL, NOS: peripheral T-cell lymphoma, not otherwise specified. *P<0.05, **P<0.005, ***P<0.001.
Haematologica | 110 January 2025
 135


