


Page 140 - Haematologica Vol. 110 - January 2025
P. 140
ARTICLE - Immune microenvironment in nodal PTCL P. Stephan et al. A
BC
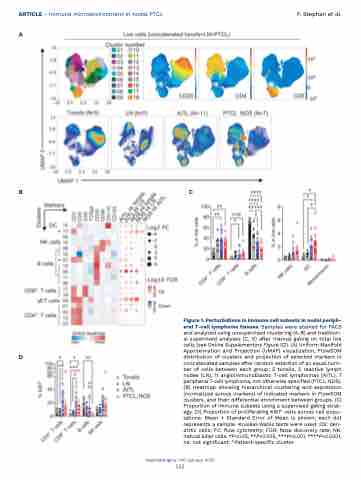
Figure 1. Perturbations in immune cell subsets in nodal periph- eral T-cell lymphoma tissues. Samples were stained for FACS and analyzed using unsupervised clustering (A-B) and tradition- al supervised analyses (C, D) after manual gating on total live cells (see Online Supplementary Figure S2). (A) Uniform Manifold Approximation and Projection (UMAP) visualization, FlowSOM
D distribution of clusters and projection of selected markers in concatenated samples after random selection of an equal num- ber of cells between each group: 5 tonsils, 5 reactive lymph nodes (LN), 11 angioimmunoblastic T-cell lymphomas (AITL), 7 peripheral T-cell lymphoma, not otherwise specified (PTCL, NOS). (B) Heatmap showing hierarchical clustering and expression (normalized across markers) of indicated markers in FlowSOM clusters, and their differential enrichment between groups. (C) Proportion of immune subsets using a supervised gating strat- egy. (D) Proportion of proliferating Ki67+ cells across cell popu- lations. Mean + Standard Error of Mean is shown; each dot represents a sample. Kruskal-Wallis tests were used. DS: den- dritic cells; FC: flow cytometry; FDR: false discovery rate; NK: natural killer cells. *P<0.05, **P<0.005, ***P<0.001, ****P<0.0001,
ns: not significant. ^Patient-specific cluster.
Haematologica | 110 January 2025
 132


