


Page 139 - Haematologica Vol. 110 - January 2025
P. 139
ARTICLE - Immune microenvironment in nodal PTCL
P. Stephan et al.
PFS and OS of our PTCL cohort corroborated previous re- ports (Online Supplementary Figure S1A).
To identify disease-specific cell populations, we first nor- malized the data to attenuate the batch effect, concate- nated all lymphoid tissue (tumoral LN, non-tumoral tonsil, reactive LN) samples, and carried out a series of unsuper- vised analyses. PBMC were not included in these analyses to avoid major changes in cell-type distribution (data not shown). Two-dimensional reduction through Uniform Manifold Approximation and Projection (UMAP) and com- puter-driven clustering through FlowSOM conducted on cell-type markers (CD3, CD4, CD8, CD56, TCRgd, CD163, CD11c, CD20) identified 18 clusters, largely corresponding to classical immune lineages (T cells, NK cells, B cells, DC) (Figure 1A, B, Online Supplementary Tables S6 and S7). Interestingly, this unsupervised analysis revealed a clear distinction between samples from PTCL patients and non-tumoral samples (Figure 1A, Online Supplementary Figure S1B). Specifically, we detected tissue-specific B-cell and T-cell clusters, and noted that DC (cluster 14) were higher in both AITL and PTCL, NOS samples compared to control LN or tonsil samples (Figure 1B). Two patient-spe- cific clusters with aberrant phenotypes, namely cluster 13 (CD3+CD4-CD8-) and cluster 7 (CD3+CD4+CD20+) were differ- entially represented between NOS and AITL samples, though the proportions of the remaining cell subtypes were very similar. Supervised analyses based on traditional manual gating revealed a strong decrease in B cells in PTCL sam- ples compared to non-tumoral tissues, and an increase in DC (Figure 1C, Online Supplementary Figure S2). CD4+ and CD8+ T cells were also more abundant in PTCL compared to tonsil samples, but not reactive LN. Of note, NK cells (CD7+CD56+) were slightly more abundant without reaching statistical significance.
To assess the putative link between the abundance of cell types and their proliferation, we measured Ki67 ex- pression, and found a systematic increase in proliferating CD4+ and CD8+ T cells in malignant samples (Figure 1D). A trend toward B-cell proliferation was observed in PTCL, NOS samples compared to controls. This was not the case in AITL samples, probably because TFH features of tumor cells enhance B-cell activation, maturation, and proliferation.19
Analysis of CD4+ T-cell subsets in peripheral T-cell lymphoma
Next, we analyzed the features of CD4+Foxp3- conventional (Tconv) cells, that contained both transformed and normal cells, in PTCL compared to tonsils and reactive LN. Based on histological evaluation at diagnosis, all patients of our AITL cohort displayed a CD3+CD4+CD8- Foxp3- tumor cell phenotype, whereas 2 of our PTCL, NOS patients harbored a CD3+CD4-CD8- phenotype (Figure 1B, Online Supplementary Table S2). We used UMAP and FlowSOM algorithms with T-cell markers, proliferation / activation proteins and check-
point receptors as variables (Figure 2A). Cells were highly activated in all samples, with only a minority of CD45RA+ naïve-like cells (Figure 2B). We identified 21 clusters, corre- sponding to cells expressing divergent levels of CD7/CD10, Ki67 and many checkpoints, including TFH markers, such as ICOS and PD-1. Strikingly, a series of clusters from PTCL samples were clearly separated from control samples on the UMAP, highlighting the fact that transformation deeply impacted the Tconv cell phenotype either in an intrinsic or extrinsic manner (Figure 2C). Indeed, control samples harbored significantly more classical CD7+PD-1+ICOS+CX- CR5+ TFH cells than PTCL (clusters 5, 19, and 20), whereas AITL samples comprised discrete and specific phenotypes, including CD10+ and/or CD7- cells as expected, but also showing high expression of LAG-3 (cluster 15), or OX-40 (cluster 8). In PTCL, NOS, we observed patient-specific clusters, such as a cytotoxic phenotype (patient 11, cluster 11) and a TCRgd+ malignancy (patient 20, cluster 2). Tconv cells from AITL patients were also highly heterogeneous, with variable expression of checkpoints (Online Supple- mentary Figure S3A, B). Because of this heterogeneity, hierarchical clustering failed to fully discriminate reactive LN from PTCL samples (Online Supplementary Figure S3C). Analysis through manual gating confirmed strong expres- sion of PD-1 and ICOS in AITL (>50% cells expressing ICOS, PD-1 or both), but without reaching statistical significance. Interestingly, the proportion of PD1+ICOS+ double positive cells in PTCL, NOS samples was reduced compared to tonsils and AITL, showing that most cells did not adopt a full TFH-like phenotype (Figure 2D). Thus, in addition to TFH markers widely used for diagnosis, we show that CD4+ T cells from AITL samples adopt a highly activated state, often characterized by heterogeneous expression of different checkpoint molecules.
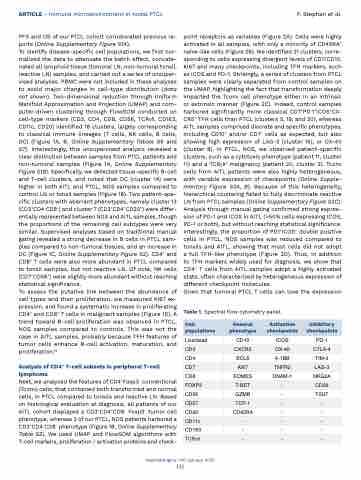
Given that tumoral PTCL T cells can lose the expression Table 1. Spectral flow cytometry panel.
 Cell populations
 General phenotype
 Activation checkpoints
 Inhibitory checkpoints
 Live/dead
  CD10
  ICOS
  PD-1
 CD3
CXCR5
OX-40
CTLA-4
 CD4
  BCL6
  4-1BB
  TIM-3
 CD7
Ki67
TNFR2
LAG-3
 CD8
 EOMES
 DNAM-1
 NKG2A
 FOXP3
 T-BET
 -
 CD39
 CD56
  GZMB
  -
  TIGIT
 CD57
TCF-1
-
-
 CD20
 CD45RA
 -
 -
 CD11c
 -
 -
 -
 CD163
  -
  -
  -
 TCRgd
 -
 -
 -
   Haematologica | 110 January 2025
131


