


Page 132 - Haematologica Vol. 110 - January 2025
P. 132
ARTICLE - CITE-seq analysis of HU effects on CML cells
H. Komic et al.
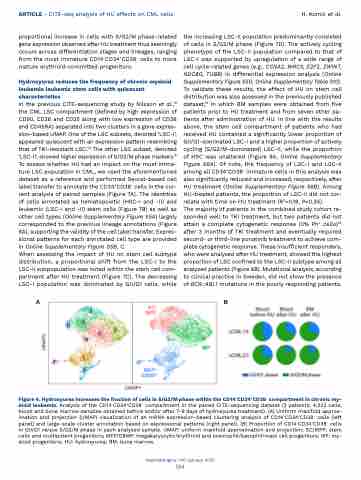
proportional increase in cells with S/G2/M phase-related gene expression observed after HU treatment thus seemingly occurs across differentiation stages and lineages, ranging from the most immature CD14-CD34+CD38- cells to more mature erythroid-committed progenitors.
Hydroxyurea reduces the frequency of chronic myeloid leukemia leukemic stem cells with quiescent characteristics
In the previous CITE-sequencing study by Nilsson et al.,19 the CML LSC compartment (defined by high expression of CD90, CD26 and CD25 along with low expression of CD38 and CD45RA) separated into two clusters in a gene expres- sion-based UMAP. One of the LSC subsets, denoted ‘LSC-I’, appeared quiescent with an expression pattern resembling that of TKI-resistant LSC.23 The other LSC subset, denoted ‘LSC-II’, showed higher expression of S/G2/M phase markers.19 To assess whether HU had an impact on the most imma- ture LSC population in CML, we used the aforementioned dataset as a reference and performed Seurat-based cell label transfer to annotate the CD34+CD38- cells in the cur- rent analysis of paired samples (Figure 7A). The identities of cells annotated as hematopoietic (HSC-I and -II) and leukemic (LSC-I and -II) stem cells (Figure 7B) as well as other cell types (Online Supplementary Figure S5A) largely corresponded to the previous lineage annotations (Figure 6A), supporting the validity of the cell label transfer. Expres- sional patterns for each annotated cell type are provided in Online Supplementary Figure S5B, C.
When assessing the impact of HU on stem cell subtype distribution, a proportional shift from the LSC-I to the LSC-II subpopulation was noted within the stem cell com- partment after HU treatment (Figure 7C). The decreasing LSC-I population was dominated by G0/G1 cells, while
the increasing LSC-II population predominantly consisted of cells in S/G2/M phase (Figure 7D). The actively cycling phenotype of the LSC-II population compared to that of LSC-I was supported by upregulation of a wide range of cell cycle-related genes (e.g., CCNA2, BIRC5, E2F2, ZWINT, NDC80, TUBB) in differential expression analysis (Online Supplementary Figure S5D, Online Supplementary Table S10). To validate these results, the effect of HU on stem cell distribution was also assessed in the previously published dataset,19 in which BM samples were obtained from five patients prior to HU treatment and from seven other pa- tients after administration of HU. In line with the results above, the stem cell compartment of patients who had received HU contained a significantly lower proportion of G0/G1-dominated LSC-I and a higher proportion of actively cycling (S/G2/M-dominated) LSC-II, while the proportion of HSC was unaltered (Figure 8A, Online Supplementary Figure S6A). Of note, the frequency of LSC-I and LSC-II among all CD34+CD38- immature cells in this analysis was also significantly reduced and increased, respectively, after HU treatment (Online Supplementary Figure S6B). Among HU-treated patients, the proportion of LSC-II did not cor- relate with time on HU treatment (R2=0.18, P=0.35).
The majority of patients in the combined study cohort re- sponded well to TKI treatment, but two patients did not attain a complete cytogenetic response (0% Ph+ cells)24 after 3 months of TKI treatment and eventually required second- or third-line ponatinib treatment to achieve com- plete cytogenetic response. These insufficient responders, who were analyzed after HU treatment, showed the highest proportion of LSC confined to the LSC-II subtype among all analyzed patients (Figure 8B). Mutational analysis, according to clinical practice in Sweden, did not show the presence of BCR::ABL1 mutations in the poorly responding patients.
AB
Figure 6. Hydroxyurea increases the fraction of cells in S/G2/M phase within the CD14-CD34+CD38- compartment in chronic my- eloid leukemia. Analysis of the CD14-CD34+CD38- compartment in the paired CITE-sequencing dataset (2 patients; 4,222 cells; blood and bone marrow samples obtained before and/or after 7-9 days of hydroxyurea treatment). (A) Uniform manifold approx- imation and projection (UMAP) visualization of an mRNA expression-based clustering analysis of CD14-CD34+CD38- cells (left panel) and large-scale cluster annotation based on expressional patterns (right panel). (B) Proportion of CD14-CD34+CD38- cells in G0/G1 versus S/G2/M phase in each analyzed sample. UMAP: uniform manifold approximation and projection; SC/MPP: stem cells and multipotent progenitors; MEP/EBMP: megakaryocytic/erythroid and eosinophil/basophil/mast cell progenitors; MP: my- eloid progenitors; HU: hydroxyurea; BM: bone marrow.
Haematologica | 110 January 2025
 124


