


Page 130 - Haematologica Vol. 110 - January 2025
P. 130
ARTICLE - CITE-seq analysis of HU effects on CML cells
H. Komic et al.
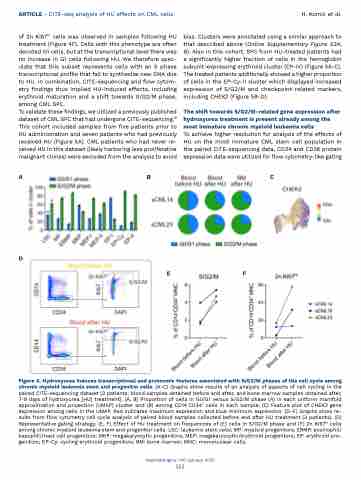
of 2n Ki67hi cells was observed in samples following HU treatment (Figure 4F). Cells with this phenotype are often denoted G1 cells, but at the transcriptional level there was no increase in G1 cells following HU. We therefore spec- ulate that this subset represents cells with an S phase transcriptional profile that fail to synthesize new DNA due to HU. In combination, CITE-sequencing and flow cytom- etry findings thus implied HU-induced effects, including erythroid maturation and a shift towards S/G2/M phase, among CML SPC.
To validate these findings, we utilized a previously published dataset of CML SPC that had undergone CITE-sequencing.19 This cohort included samples from five patients prior to HU administration and seven patients who had previously received HU (Figure 5A). CML patients who had never re- ceived HU in this dataset (likely harboring less proliferative malignant clones) were excluded from the analysis to avoid
bias. Clusters were annotated using a similar approach to that described above (Online Supplementary Figure S3A, B). Also in this cohort, SPC from HU-treated patients had a significantly higher fraction of cells in the hemoglobin subunit-expressing erythroid cluster (EP-IV) (Figure 5A-C). The treated patients additionally showed a higher proportion of cells in the EP-Cy-II cluster which displayed increased expression of S/G2/M and checkpoint-related markers, including CHEK2 (Figure 5B-D).
The shift towards S/G2/M-related gene expression after hydroxyurea treatment is present already among the most immature chronic myeloid leukemia cells
To achieve higher resolution for analysis of the effects of HU on the most immature CML stem cell population in the paired CITE-sequencing data, CD34 and CD38 protein expression data were utilized for flow cytometry-like gating
ABC
D
EF
Figure 4. Hydroxyurea induces transcriptional and proteomic features associated with S/G2/M phases of the cell cycle among chronic myeloid leukemia stem and progenitor cells. (A-C) Graphs show results of an analysis of aspects of cell cycling in the paired CITE-sequencing dataset (2 patients; blood samples obtained before and after, and bone marrow samples obtained after, 7-9 days of hydroxyurea [HU] treatment). (A, B) Proportion of cells in G0/G1 versus S/G2/M phase (A) in each uniform manifold approximation and projection (UMAP) cluster and (B) among CD14-CD34+ cells in each sample. (C) Feature plot of CHEK2 gene expression among cells in the UMAP. Red indicates maximum expression and blue minimum expression. (D-F) Graphs show re- sults from flow cytometry cell cycle analysis of paired blood samples collected before and after HU treatment (3 patients). (D) Representative gating strategy. (E, F) Effect of HU treatment on frequencies of (E) cells in S/G2/M phase and (F) 2n Ki67hi cells among chronic myeloid leukemia stem and progenitor cells. LSC: leukemic stem cells; MP: myeloid progenitors; EBMP: eosinophil/ basophil/mast cell progenitors; MKP: megakaryocytic progenitors; MEP: megakaryocytic/erythroid progenitors; EP: erythroid pro- genitors; EP-Cy: cycling erythroid progenitors; BM: bone marrow; MNC: mononuclear cells.
Haematologica | 110 January 2025
 122


