


Page 128 - Haematologica Vol. 110 - January 2025
P. 128
ARTICLE - CITE-seq analysis of HU effects on CML cells
H. Komic et al.
analyzed samples (blood before and blood/BM after HU) were performed (Figure 3A). The obtained UMAP did not contain patient-specific clusters (Online Supplementary Figure S2A) and the confined protein expression of known cell type markers (Online Supplementary Figure S2B) sup- ported the validity of the mRNA-based clustering. Clusters were manually annotated based on expression patterns of known marker genes (Figure 3B, Online Supplementary Table S5), and proteins (Figure 3C, Online Supplementa- ry Table S6). Cells annotated as LSC were CD34+CD38- CD45RA-CD90+ and expressed the CML LSC markers CD25 and CD26. Myeloid progenitors (MP) were characterized by expression of SPINK2, CSF3R, CEBPA, CD45RA and CD371. While all megakaryocytic/erythroid progenitor clusters (MEP, MKP, EP) expressed the lineage-specific transcription fac- tor GATA1, megakaryocytic progenitors (MKP) were further defined by expression of MPL, VWF and CD9, and erythroid progenitor (EP) clusters by CD35. Megakaryocytic/erythroid progenitors (MEP) expressed GATA1, but lacked concurrent committed MKP/EP marker expression. The most mature EP cluster (EP-II) showed a distinct expression of HBB, AHSP and CD235a, and eosinophil/basophil/mast cell progenitors (EBMP) were characterized by expression of HDC and GATA2. To assess proportional shifts within the SPC compartment as a result of HU treatment, cells from blood and BM sam- ples obtained before and after treatment were separately highlighted on the UMAP (Figure 3D). Although all nine clusters were represented in all samples, post-treatment samples showed apparent cell density increases in EP- II and cycling erythroid progenitor (EP-Cy) clusters and
concomitant decreases in the EP-I cluster. BM samples obtained after HU treatment showed a similar pattern of cell cluster distribution as the paired blood samples, al- though the fraction of cells in the EP-II cluster was even more pronounced in the BM samples. The EP-Cy and EP- II clusters displayed increased expression of an array of checkpoint-related genes such as CCNE1 (EP-Cy, EP-II), CHEK2 (EP-Cy), CDKN2C (EP-Cy), FANCI (EP-Cy) and TRIP13 (EP-Cy) (Online Supplementary Table S5), with cells in the EP-II cluster additionally defined by upregulation of the hemoglobin subunits HBA1, HBA2, and HBB (Figure 3E). Based on this finding, we additionally employed SCENIC analysis focusing on GATA1, a key transcription factor for erythropoiesis.21 The GATA1 regulon was identified based on expressional patterns in the paired blood samples from both patients. Many genes within this regulon showed significant upregulation following HU treatment, including HBB, HBA1, E2F2 and TFRC (Online Supplementary Table S7).
Utilizing Seurat’s CellCycleScoring function, EP-Cy were defined by the high proportion of S/G2/M phase cells within the cluster (Figure 4A). Their cycling nature was also sup- ported by the cluster differential expression analysis (Online Supplementary Table S5), in which many of the upregulated genes were associated with cell division. Further exploration of the clusters displaying consistent proportional changes across patients revealed that the proportionally decreased EP-I population primarily comprised cells in G0/G1 phase, whereas the increasing EP-Cy and EP-II clusters mainly included S/G2/M phase cells (Figure 4A). The shift towards S/G2/M phase following HU treatment was also seen among
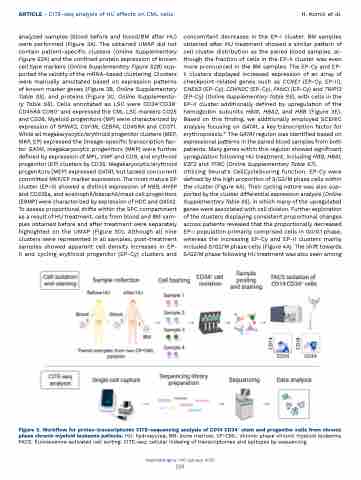
 Figure 2. Workflow for proteo-transcriptomic CITE-sequencing analysis of CD14-CD34+ stem and progenitor cells from chronic phase chronic myeloid leukemia patients. HU: hydroxyurea; BM: bone marrow; CP-CML: chronic phase chronic myeloid leukemia; FACS: fluorescence-activated cell sorting: CITE-seq: cellular indexing of transcriptomes and epitopes by sequencing.
Haematologica | 110 January 2025
120


