
Page 81 - Haematologica-5
P. 81
Proteomic profiling reveals complexity of AML MSC
PDK1 (S241)], CCND1, CDKN1A (p21), ITGA2, PARP1, PPP2R2A/B/C/D, the PP2A B regulatory subunit family B55, BAK1, CSNK2A1, CDK4, GSK3A/B) and PC2 [STAT5A/B, BCL2L1 (BCL-XL)], DIABLO, TP53 (p53), NOTCH 1 (cleaved 1744), SPP1, p-EGFR (Y992), and ERBB2). Expression of 17 of the 19 proteins was validated by immunoblot analysis (Online Supplementary Figure S3).
Although expression of EGFR and ERBB2 expression could not be confirmed by western blot analysis, this may reflect the enhanced sensitivity of RPPA over standard immunoblot technology. The remaining nine proteins in PC3 were elevated in healthy donor MSC compared to AML-MSC: SMAD1, CREB1.p133 STMN1, SIRT1, CREB1 SMAD4, p-Foxo1/3 (S32), HSP90AA1/B1, and EIF2S1.
A
B
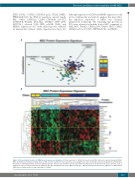
Figure 1. Mesenchymal stromal cell (MSC) protein expression signatures. Protein expression is distinct between normal MSC and acute myeloid leukemia (AML)- MSC. (A) Principal component analysis (PCA) of 151 proteins examined in Class 1 (yellow), Class 2 (light blue), Class 3 (orange) and Class 4 (dark blue). (B) Unbiased hierarchical clustering identifies 3 protein signature groups: Group 1 (11 members), Group 2 (8 members) and Group 3 (9 members) in Class 1 (yellow), Class 2 (light blue), Class 3 (orange) and Class 4 (dark blue) groups, identified in top row as “MSC protein type”. MSC derived from normal donor (light blue) or AML patient (dark blue) is shown in the second row marked “cell type”.
haematologica | 2018; 103(5)
813
