
Page 80 - Haematologica-5
P. 80
S.M. Kornblau et al.
differences are very unlikely to be random and suggest that there are significant differences in the protein expres- sion patterns of AML-MSC relative to those of NL-MSC.
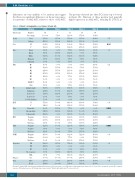
Table 1. Patients’ demographics (see Figures 2A and 3A). Variable Category Total Class 2
The proteins clustered into three PCs (from top to bottom in Figure 1B). Nineteen of these proteins had generally higher expression in AML-MSC, including P1 [STAT1, p-
Class 1 Class 3 Class 4 P Cohortsize Number 101 6 13 18 64
Status
Sex
Race
FAB
PS
AHD
Cyto
FLT3
D835
NPM1
Response
Relapse
Vital
Percentage
New
Salvage
M
F
Asian Black White Hispanic Unknown M0
M1
M2
M4
M5
M6 RAEB-T Unk Asymptomatic Symptoms In bed <50 In bed >50 100% bedridden N
Y Favorable Intermediate Unfavorable Negative Positive Not Done Negative Positive Not Done Negative Positive Not Done CR
PR
HI
No response FAIL
Yes
Alive
Dead
100.00%
53.50%
45.50% 61.40% 38.60% 6.90% 7.90% 73.30% 9.90% 3.00% 4.00% 16.80% 24.80% 26.70% 12.90% 3.00% 4.00% 7.90% 15.80% 62.40% 13.90% 2.00% 1.00% 75.20% 24.80% 2.00% 54.50% 43.60% 65.30% 20.80% 8.90% 79.20% 6.90% 8.90% 46.50% 10.90% 5.00% 58.80% 29.70% 1.00% 3.00% 6.90% 70.00% 21.60%
78.40%
5.90%
66.70%
33.30% 33.30% 66.70% 0.00% 16.70% 50.00% 33.30% 0.00% 0.00% 16.70% 16.70% 66.70% 0.00% 0.00% 0.00% 0.00% 16.70% 50.00% 33.30% 0.00% 0.00% 50.00% 50.00% 16.70% 83.30% 0.00% 33.30% 16.70% 50.00% 50.00% 0.00% 50.00% 50.00% 0.00% 50.00% 66.70% 0.00% 0.00% 33.30% 0.00% 100.00% 0.00%
100.00%
12.90%
53.80%
46.20% 30.80% 69.20% 7.70% 15.40% 69.20% 7.70% 7.70% 0.00% 38.50% 23.10% 23.10% 7.70% 0.00% 0.00% 7.70% 15.40% 46.20% 23.10% 7.70% 0.00% 84.60% 15.40% 7.70% 53.80% 38.50% 69.20% 23.10% 7.70% 92.30% 0.00% 7.70% 69.20% 7.70% 23.10% 71.40% 0.00% 0.00% 14.30% 14.30% 80.00% 28.60% 71.40%
17.80%
66.70%
33.30% 72.20% 27.80% 11.10% 0.00% 83.30% 5.60% 0.00% 5.60% 5.60% 22.20% 27.80% 16.70% 11.10% 0.00% 11.10% 11.10% 77.80% 5.60% 0.00% 5.60% 83.30% 16.70% 0.00% 50.00% 50.00% 66.70% 16.70% 16.70% 77.80% 5.60% 16.70% 72.20% 0.00% 27.80% 63.60% 0.00% 9.10% 9.10% 18.20% 28.60% 36.40% 63.60%
63.40%
48.40% 0.55
50.00%
67.20% 0.03 32.80%
6.30% 0.5
7.80% 73.40% 9.40% 3.10%
4.70% 0.21 15.60%
26.60%
23.40%
14.10% 1.60% 6.30% 7.80%
17.20% 0.44
62.50% 12.50% 1.60% 0.00%
73.40% 0.33 26.60%
0.00%
53.10%
0.026
46.90%
64.10%
21.90%
14.10%
76.60%
9.40%
14.10%
45.30% 0.08 17.20%
37.50%
53.30% 0.8
3.30% 6.70% 13.30% 23.30%
81.30% 0.076
16.70% 0.41
83.30%
0.0979
0.005
812
M: male; F: female; FAB: French-American-British Classification; PS: propensity score; AHD: antecedent hematologic disease; N: no;Y: yes; Cyto: cytogenetic profile; CR: complete response; PR: partial response; HI: hematologic improvement;*Statistically significant (P) sets are in bold.
haematologica | 2018; 103(5)
