
Page 42 - Haematologica-5
P. 42
774
F. Boulad et al.
ABC
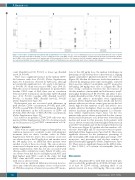
Figure 3. Association of hydroxyurea treatment with post-plerixafor cell counts. The use or not of hydroxyurea was not associated with different levels of CD34+ (P=0.66), absolute neutrophil count (ANC, P=0.66), or white blood cell count (WBC, P=0.57) 12 h after plerixafor. Peripheral blood (A) CD34 concentrations, (B) ANC, and (C) WBC at 12 h after plerixafor in 15 patients with SCD treated with 80 (circles), 160 (squares) and 240 (triangles) μg/kg of plerixafor. Patients on hydroxyurea are represented by filled circles, squares and triangles, patients off hydroxyurea are represented by open circles, squares and triangles.
count (Kendall tau=0.30, P=0.13) or donor age (Kendall tau=0.14, P=0.49).
There was a significant increase in the median CD34+ fold increase with dose (P=0.01) (Online Supplementary Figure S1). A trend was observed for ANC ratio, although not statistically significant (1.6-, 1.8-, and 2.1-fold increas- es, P=0.08). No trend was seen for WBC ratio (P=0.13). With the caveat of statistical adjustment for patient 8(2)'s baseline CD34+ count of 0/μL, there was no correlation between CD34+ fold increase and baseline CD34+ (Kandall tau= -0.32, P=0.11), baseline ANC (Kendall tau=0.19, P=0.32), or baseline WBC (Kendall tau=0.22, P=0.25) (Online Supplementary Figure S2).
Hydroxyurea was not associated with differences in peak absolute CD34+ concentration (P=0.95), peak ANC (P=0.59) or peak WBC (P=0.68) concentrations (Figure 3); or with differences in the fold increases of CD34+ cell (P=0.64), ANC (P=0.12), or WBC (P=0.36) concentrations (Online Supplementary Figure S3).
In a subset of six patients, CD34+CD38– cells were enu- merated (Online Supplementary Table S3), showing a medi- an 3-fold increase in CD34+CD38– concentrations at 12 h.
Safety of plerixafor
There were no significant changes in hemoglobin con- centration, hematocrit, or platelet counts with plerixafor treatment (data not shown, baseline values in Online Supplementary Table S1). Due to the occurrence of one seri- ous adverse event at the 80 μg/kg dose and another one at the 240 μg/kg dose, an additional three patients were enrolled at each of these dose levels. The serious adverse events were both pain crises, possibly related to plerixafor (Online Supplementary Table S4), but also associated with other possibly contributory events. Patient 13 with a seri- ous adverse event had the second highest peak ANC (and third highest peak WBC count) in the study, but high WBC count and ANC were not consistently associated with serious adverse events.
There were no significant differences between dose lev- els for any of the activation markers of vaso-occlusion test- ed. With the exception of tissue factor-positive (TF+) mono-
cytes at the 240 μg/kg dose, the median fold-changes in percentage of cells at every dose cohort were ≤1.1, arguing against generalized plerixafor-mediated cell activation (Figure 4A). Median fold increases in absolute numbers of activated β2 integrin-positive (aβ2+) neutrophils, activated Mac-1-positive (aMac-1+) neutrophils, and TF+ monocytes (160 μg/kg, 240 μg/kg) were close to 2 (Figure 4B). There were strong correlations between the fold increase in absolute numbers of neutrophils and fold increases in aβ2+ neutrophils (Kendall tau=0.85, P<0.001) and aMac-1+ neu- trophils (Kendall tau=0.46, P=0.02). The absolute numbers of aβ2+ and aMac-1+ neutrophils were significantly increased (Online Supplementary Figure S4A,B), and the two patients with serious adverse events (gray arrows) had rel- atively high absolute numbers of aβ2+ and aMac-1+ neu- trophils, albeit not the highest. There was also a significant increase in plasma prothrombin fragment 1.2 concentra- tions (Online Supplementary Figure S4C), but the two patients with serious adverse events had absolute concen- trations and fold increases at 12 h that were lower than the median and mean for that measure. Both patients with serious adverse events had relatively high fold-increases in L-selectinneg neutrophils and one had a large fold increase in TF+ monocytes (Figure 5), but their absolute numbers of L- selectinneg neutrophils and TF+ monocytes were not partic- ularly high (Online Supplementary Figure S4D,E). There were significant decreases for five parameters: percentage of aβ2+ neutrophils, MFI of aβ2 neutrophils, percentage of TF+ monocytes, and percentage and absolute number of platelet-neutrophil aggregates (Online Supplementary Figure S5). There were no significant changes in the MFI of aMac- 1+, Mac-1, LFA-1, or L-selectin on neutrophils (data not shown).
Discussion
Eight of 15 patients (53%) with SCD treated with pler- ixafor reached the peripheral blood CD34 cell target count of at least 30 CD34+ cells/μL, including three of six patients treated at a dose of 240 μg/kg. This is in contrast
haematologica | 2018; 103(5)
