
Page 86 - Haematologica-April 2018
P. 86
630
O.K. Weinberg et al.
AB
CD
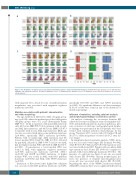
Figure 2. The distribution of dysplasia scores by mutational pathway, subclone status and individual mutation. (A) Erythoid lineage dysplasia scores with mutation pathways and individual mutations. (B) Myeloid dysplasia scores. (C) Megakaryocyte dysplasia scores. (D) Dysplasia scores based on Lindsley et al. molecular ontogeny group.14
with separated lobes. A lack (0 score) of erythroid nuclear irregularities was associated with epigenetic regulator mutations (q=0.035).
Mutation association with patients’ characteristics and other morphology
The age distribution differed by AML ontogeny group- ings (q=0.002), where the median ages in the AML genetic ontogeny groups were 47.1 years [Interquartile Range (IQR 34.0 - 64.2)] for patients with pan-AML mutations only, 64.8 years (IQR 55.5-70.2) for patients with second- ary AML type mutations, and 60.5 years (IQR) 51.5-67.3 for patients with de novo AML type mutations. Older age was also associated with spliceosome pathway mutations (q<0.0001), specifically SRSF2 mutation (q<0.0001). Patients with secondary-type AML mutations had the lowest median WBC (3.4x10⁹/L; IQR 2.0-35.1) followed by pan-AML (16.2x10⁹/L; IQR 3.4-43.7) and de novo AML had the highest median WBC (60.5x10⁹/L; IQR 51.5-67.3, q=0.003). At presentation, a lower median WBC was found in AML with epigenetic regulator mutations (q=0.003), spliceosome mutations (q=0.015), ASXL1 (q=0.015) and BCOR (q=0.0029) mutations. A higher median WBC was found in AML with RAS pathway mutations (q<0.0001) and AML with NPM1 mutations (q=0.004).
Evaluation of BM showed that higher BM cellularity was associated with RAS pathway mutations (q=0.029),
specifically FLT3-ITD (q=0.029), and NPM1 mutations (q=0.029). No significant differences in blast percentages in blood or BM were found in any of the mutations or mutation groupings.
Influence of mutations, including subclone analysis, and morphological findings on event-free survival
An analysis evaluating the association between EFS adjusted for receipt of allogeneic stem cell transplant (allo- SCT) and individual mutations, mutation pathways, pres- ence or absence of subclones, and morphological dysplas- tic findings was performed in the 153 patients who were treated with standard induction chemotherapy. In this group, 75 patients (49%) received allo-SCT in first CR and 26 (17%) additional patients received allo-SCT after dis- ease relapse.
In transplant-adjusted univariate analysis, NPM1 muta- tion was associated with longer EFS (nominal P=0.042), while RUNX1 (P=0.042) and NF1 (P=0.04) mutations were associated with shorter EFS. Patients with secondary AML type mutations had shorter EFS (P=0.011) compared to patients with de novo AML type mutations (P=0.011). The presence of a subclone (see Figure 3) was also associated with shorter EFS (P=0.002). Among morphological fea- tures, the presence of frequent micromegakaryocytes (score ≥3) was associated with shorter EFS (P=0.018). Regarding the effect of the WHO Classification-defined AML-MRC category, there was no significant difference in
haematologica | 2018; 103(4)
