
Page 85 - Haematologica-April 2018
P. 85
Correlation of mutations with morphological findings in AML
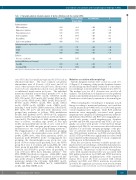
Table 1. Transplant-adjusted univariate analysis of factors affecting event-free survival (EFS). Coefficient Exp (coefficient)
SE (coefficient)
0.224 0.217 0.225 0.283 0.219 0.233
0.264 0.216 0.431
0.222
0.276
0.244
P
0.342 0.086 0.469 0.23 0.903 0.055
0.042 0.042 0.04
0.002
0.17
0.011
Pathway mutation DNA methylation Epigenetic regulators Transcription factors Cohesin pathway
Ras pathway
Spliceosome pathway
Individual mutation significantly associated with EFS
RUNX1 NPM1 NF1
Subclone
Presence of subclone
Lindsley AML Ontogeny Grouping*
Pan AML
Secondary AML
[Hazard Ratio]
-0.213 0.808 0.372 1.451 0.163 1.177 0.34 1.404 0.027 1.027 0.446 1.562
0.537 1.71 -0.44 0.644 0.887 2.429
0.686 1.987
0.378 1.46
0.62 1.858
EXP: expansion; SE: Standard Error; AML: acute myeloid leukemia. *Reference group is de novo AML.
cases (81%) had a normal karyotype and 31 (18%) had an abnormal karyotype. The most common cytogenetic abnormalities were +8 (8 cases), +11 (4 cases), and +13 (2 cases); other trisomies were seen in 8 cases, chromosome losses in 3 cases, ring chromosome in 1 case, and balanced or unbalanced translocations in 5 cases. The individual mutations identified in more than 5 patients (>3% of the study cohort) were: NPM1 (n=72), DNMT3A (n=68), FLT3-ITD (n=44), TET2 (n=40), FLT3 (n=26), IDH1 (n=31), ASXL1 (n=30), NRAS (n=30), SRSF2 (n=28), IDH2 (n=27), RUNX1 (n=27), PTPN11 (n=20), WT1 (n=15), STAG2 (n=14), BCOR (n=10), BCORL1 (n=6), CEBPA (n=11, including 3 with double CEBPA mutations), KRAS (n=8), RIT1 (n=8), NF1 (n=7) and CBL (n=6). Mutations were grouped into pathways as follows: DNA methylation (n=120), RAS pathway (n=97), NPM1 (n=72), epigenetic regulators (n=50), transcription factors (n=51) and spliceo- some (n=39). The Lindsley et al. AML ontogeny groupings were as follows: secondary type (n=60), de novo type (n=64), and pan-AML type (n=42); 2 cases could not be assigned to the AML ontogeny group because of missing information for one or more group-defining mutations.14 The Pappaemanuil et al. AML classification groupings were as follows: chromatin-spliceosome (n=60), NPM1 (n=69), CEBPA (n=3), other driver mutations (n=23), no mutations (n=5), IDH2R172 (n=6).26 Comparing the two groupings, the chromatin/spliceosome group was com- posed of 54 secondary and 6 pan-AML cases; the NPM1 group 64 de novo, 4 secondary, and 1 pan-AML; the other driver group 22 pan-AML and 1 secondary AML; the no mutation and IDH2R172 groups were all pan-AML. A total of 92 cases (55%) had a leukemia subclone.20 The 2016 WHO Classification categories (AML-MRC being defined as ≥50% dysplastic cells present in at least 2 line- ages, in the absence of NPM1, double CEBPA, or RUNX1 mutations) included the following: AML-MRC (n=19), AML-NOS (n=50), AML-NPM1 (n=71), AML-RUNX1 (n=25), and AML-CEBPA (n=3).
Mutation association with morphology
Specific dysplastic features were scored on a scale of 0- 4 ( Figure 1). A summary of the specific dysplastic features in each lineage and the Kendall coefficient of concordance for each lineage is shown in Online Supplementary Table S1. The median score for all 3 observers was used for all analyses. The distribution of dysplasia scores by pathway mutation and individual mutation is presented in Figure 2. Distribution of subclones by mutations is shown in Figure 3.
When evaluating the overall degree of dysplasia in each lineage according to mutational pathways, we found that cohesin mutations (q=0.046) were associated with greater overall megakaryocytic dysplasia, while RAS pathway mutations were marginally associated with greater megakaryocytic dysplasia. Evaluating mutations individu- ally indicated that STAG2 and RIT1 were marginally asso- ciated with greater overall megakaryocyte dysplasia (q=0.064 and q=0.056, respectively) and STAG2 also mar- ginally associated with greater overall myeloid lineage dysplasia (q=0.052). No association was detected between Lindsley et al. molecular ontogeny groupings or the pres- ence of a subclone with the overall dysplasia in any line- ages. RAS pathway mutations (q=0.006) and specifically an FLT3-ITD (q=0.006) were significantly associated with non-evaluable erythroid lineage due to a lack of significant erythropoiesis in the leukemic BM.
Next, the associations between evaluable specific dys- plastic features in each lineage, with individual mutations, pathways, AML genetic ontogeny grouping and subclones were explored. The presence of any (score >0) megakary- ocytes with separated nuclear lobes was associated with RAS pathway mutations (q=0.0425) and NPM1 mutations (q=0.022). Frequent megakaryocytes with separated nuclear lobes (score ≥3) were associated with cohesin pathway (q=0.010), and STAG2 mutations in particular (q=0.010). No significant associations were detected when considering a score cut off of 2 or over for megakaryocytes
haematologica | 2018; 103(4)
629
