
Page 77 - Haematologica-April 2018
P. 77
Gfi1b in AML and MDS
A
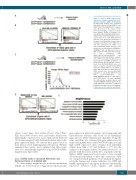
Figure 6. Loss of Gfi1b induces gene
B
with Gfi1bfl/flMxCrewtNUP98/HOXD13 and
C
fl/fl wt
Gfi1b MxCre NUP98/HOXD13 and
expression changes supporting acute
myeloid leukemia (AML) development.
(A) Microarray analysis was performed
Gfi1bfl/flMxCretgNUP98/HOXD13 leukemic
cells. (B) Based on the results of the
micro-array analysis, a Gene set enrich-
ment analysis (GSEA) of leukemic cells
from Gfi1bfl/flMxCrewtNUP98/HOXD13tg an
d Gfi1bfl/flMxCretgNUP98/HOXD13tg mice w
as performed. As a result, Gfi1b deficient
leukemic cells showed an enrichment of
the gene set of VALK AML cluster 8 with a
normalized enrichment score (NES) of 2.1
and false discovery rate (FDR) of q-
val=0.00191213. Gfi1b deficient cells
showed also an enrichment for RAMALHO
STEMNESS with an NES=2.41 and an
FDR q-val=0.(C) ChIP and ChIP-Seq analy-
sis was performed with
Gfi1bfl/flMxCretgNUP98/HOXD13 leukemic cells. ChIP-Seq analysis for differences in the frequency of H3K9 acetylation of Gfi1b-deficient (Gfi1bfl/flMxCretg) leukemic blasts from NUP98/HOXD13tg mice com- pared to leukemic cells with normal Gfi1b expression (Gfi1bfl/flMxCrewt). (D) GSEA of genes with an elevated acetylation level in Gfi1b deficient mice are associated with regulation of cell growth NES=1.78 and FDR q-val=0.055857178 and GNF2_MAP2K3 NES=2.02 and FDR q- val=1.7715618E-4. (E) Upon analyzing the differentially acetylated genes and using the MSigDB Pathway approach, we found significant enrichment of different pathways, among them the p38 pathway. P-value was used to rank the enrichment.
D
E
(Abcg2, Gata3, Itga2, Thy1, Cd24a, Pecam1, Prom1, Plaur, Klf4, Mycn, Ptch1, Pecam1, Sav1, and Notch1), which were differentially expressed by more than 2-fold between Gfi1b-expressing and Gfi1b-deficient leukemic mice in the gene expression arrays. We selected these genes based on their diverse role in regulating stem cell function. We then examined these genes and confirmed that these genes were also differentially expressed using RT-PCR (Online Supplementary Figure S8A).
Loss of Gfi1b leads to increased ROS levels and decreased levels of activated p38
To obtain further insight into the molecular mechanism behind our observation we compared the whole genome
gene expression pattern in murine Gfi1b-expressing and Gfi1b-deficient leukemic cells based on an AltAnalyze approach (see Online Supplementary Appendix). Using the same algorithm, we compared the gene expression pat- tern found in AML blasts with low GFI1B expression and high GFI1B expression (data obtained from published studies from Valk et al.21 and Verhaak et al.22). For the analysis of the human dataset, we analyzed the 10% of patients with the lowest and the 20% of patients with the highest GFI1B expression level in order to have enough observations from which to draw any conclusions. Then we compared which pathways were similarly deregulat- ed in the human and murine leukemia sets. ROS and MAPK signaling were among the pathways differentially expressed between both murine and human
haematologica | 2018; 103(4)
621
