
Page 48 - Haematologica-April 2018
P. 48
T. Lefebvre et al.
amelioration was more pronounced in children, with hyperferritinemia observed in 14% of treated versus 73% of untreated patients (P=0.008). ERT also tended to improve TS, with a mean value of 28.7% in men, 29.8% in women and 19.9% in children (Table 1). Regarding the hepcidin response, we found that ERT led to slightly increased serum hepcidin levels in men. However, in women and children, the serum hepcidin levels remained unchanged, most likely because hemoglobin in these two groups was lower and may maintain hepcidin levels within the minimal range for erythropoiesis iron avail- ability. ERT markedly increased the hemoglobin levels, and none of the treated patients remained anemic (Online Supplementary Table S3). Indeed, the average hemoglobin levels increased by 1.4 g/dL in men, 1.7 g/dL in women and 1.9 g/dL in the pediatric group (Table 1). Moreover, the longitudinal monitoring of the biological parameters of patients before/after ERT analyzed by a paired com- parison significantly highlighted the tendencies observed in the global cohort study. This patient follow up demon-
strated reduced ferritin levels, increased TS and improved hemoglobin levels, suggesting the involvement of iron release and underlying the need for its bioavail- ability for erythropoiesis recovery (Figure 6A-C). We also quantified the serum hepcidin level at different time points during ERT. Interestingly, we observed that the kinetics of systemic hepcidin secretion reflected a posi- tive and transient adaptive response against iron release in circulation. Compared to untreated patients, the hep- cidin level increased significantly between six months and five years of treatment and then returned to the baseline value five years post ERT (Figure 6D). In addi- tion, we also observed significantly lower serum soluble transferrin receptor levels in all treated patients than in untreated patients (Figure 6E).
We monitored the time course of different biological parameters in 2 representative patients: one who began the ERT during adolescence and the other who began treatment later in adulthood. The 2 patients were fol- lowed up to 25 months post ERT, and the ERT efficacy
A
Merge Merge
BCD
592
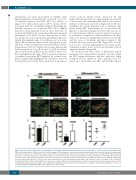
Figure 4. Impact of glucocerebrosidase activity inhibition on ferroportin (FPN) and hepcidin expression in the J774 cell line. J774 cells were incubated with 1 mM CBE (+CBE) or with vehicle (-CBE) for 96 hours (h). (A) Staining of FPN and actin were performed as described in the Methods section. FPN is labeled in green and actin in red. In the absence of CBE, FPN is stained mostly at the plasma membrane with some intracellular extent. In the presence of CBE, FPN membrane staining was reduced, and its localization was mostly intracellular. The cross-section images demonstrated a significant overlap of FPN and actin staining in the -CBE condi- tion but not in the +CBE condition. Images were taken by confocal microscopy (60X). (B and C) Quantification of the mRNA expression levels of FPN (B) and hepcidin (C) from treated and untreated J774 cells. Data were normalized by the housekeeping transcript Hprt1 and expressed as the percentage of the -CBE group mean±Standard Error of Mean. Mann-Whitney test was used to compare RNA levels. (D) Quantification of ferritin in cellular extracts from treated and untreated J774 cells. Data were expressed as percentage of the control mean. Medians are represented by the horizontal line. According to a two-tailed Mann-Whitney test, the level of cellular ferritin was significantly higher in the CBE treated cells; P=0.021.
haematologica | 2018; 103(4)
