
Page 39 - Haematologica-April 2018
P. 39
Erythropoietin receptor mutations in PFCP
function mutant that induces major erythropoietin hyper- sensitivity in primary cells as well as in transduced Ba/F3 cells, without spontaneous growth, in accordance with the diagnosis of PCFP.
Previous reports assumed that the erythropoietin hyper- sensitivity phenotype observed in PFCP is due to the loss of negative regulatory domains located in the C-terminal part of the receptor, especially some conserved tyrosine residues.30,31 Both the magnitude and duration of EPOR sig- naling are indeed crucial for erythropoiesis and are there- fore tightly regulated by several mechanisms induced as soon as erythropoietin binds to its cognate receptor. A classic negative feedback loop is achieved by signaling
A
inhibitors such as the tyrosine phosphatase SHP-138 and the suppressor of cytokine signaling (SOCS) proteins SOCS3 and CIS,39 which bind the conserved Tyr-426, -454 and -456 on the cytoplasmic tail of EPOR (Figure 6A). Rapid internalization and degradation of the receptor induced by erythropoietin binding34 also contribute to the negative regulation of EPOR signaling. Several possible cooperative and partially redundant mechanisms are involved in this process, but their relative contributions remain unclear. The C-terminal part of EPOR is degraded at the cell surface by the proteasome.34,35 This step requires binding of the E3-ligase βTrcp to a conserved motif Asp461-Ser462-Gly463 of EPOR (Figure 6A).36 The ery-
BC
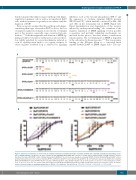
Figure 5. Different mechanisms are involved in the erythropoietin hypersensitivity phenotype of primary familial and congenital polycythemia depending on the type of EPOR mutation. (A) Ba/F3 cells were transduced with pMX-HA-huEPOR-IRES-GFP retrovirus to stably express different kind of EPOR mutations already described: the frameshift EPOR c.1311_1312del mutant (p.Pro438Metfs*6) or its nonsense designed counterpart EPOR c.1327_1329delinsTAA (p.Pro443*), more proximal truncations due to the nonsense mutants EPOR c.1195G>T (p.Glu399*) and c.1273G>T (p.Glu425*). (B, C) Proliferation was assessed 48 h after culturing EPOR p.Pro438Metfs*6 and p.Pro443* Ba/F3 cells (B) or EPOR p.Glu399* and p.Glu425* Ba/F3 cells (C) in the absence or presence of increasing doses of EPO (0.01, 0.02, 0.03, 0.05, 0.1, 0.3, and 1 U/mL) and compared to EPOR WT and EPOR FS growth by a WST-1 proliferation assay. Dose-response curves are means expressed in percentages of maximum growth value ± SEM (n = 3 in triplicate). Two-tailed t-test, *P<0.05, **P<0.01, ***P<0.001, ****P<0.0001.
haematologica | 2018; 103(4)
583
