
Page 130 - Haematologica-April 2018
P. 130
A. Arvidsson et al. AB
C
D
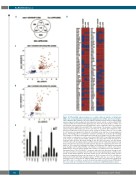
Figure 4. Differentially expressed genes in co-culture adherent mantle cell lymphoma (MCL) cells overlap with microenvironment-regulated genes in MCL and chronic lympho- cytic leukemia (CLL) patients. (A) Venn diagram showing overlaps between differentially expressed genes between adherent and suspension Jeko-1 cells in co-culture (ADH/SUSP) compared with microenvironment-regulated genes from microarray studies of MCL and
E CLL patients, where transcript levels in lymph nodes were compared to those of peripheral blood (data from GSE21029 and GSE70910, respectively). The numbers of differentially expressed genes (FDR q-value ≤ 0.05) for each data set are shown. (B) Comparison of the direction of regulation for the 116 genes in the overlap of all three data sets. Color-coding is red for genes up-regulated in adherent cells/lymph node and blue for down-regulated genes. Fold change values are shown for each gene and data set. (C) Scatter plot showing fold changes for 348 genes with significant transcript level changes in both adherent MCL cells relative to suspension co-culture cells (Jeko-1 ADH-SUSP FC) and MCL patient lymph node relative to peripheral blood (MCL LN-PB FC). Spearman Rho=0.843 (P=1.83x10-68) for genes with coherent directional change in the two data sets where red data points (n=135) represent up-regulated genes and blue data points (n=114) down-regulated. Gray data points (n=99) represent genes with opposite direction of regulation between the two data sets. (D) Scatter plot showing fold changes for 228 genes with significant transcript level changes in both adherent MCL cells relative to suspension co-culture cells (Jeko-1 ADH-SUSP FC) and CLL patient lymph node relative to peripheral blood (CLL LN-PB FC). Spearman Rho=0.746 (P=8.39x10⁻²⁹) for genes with coherent directional change in the two data sets where red data points (n=121) represent up-regulated genes and blue data points (n=34) down-regulated. Gray data points (n=73) represent genes with opposite direction of regulation between the two data sets. (E) A core gene set of 13 cell-adhesion related microenvironmentally regulated genes in MCL and CLL (see text for details). Transcript levels of the genes in adherent (ADH, black bars) and suspension (SUSP, gray bars) MCL cells in co-cultures are plotted; mean transcripts per million reads (TPM) where
the read counts are normalized to library size and feature length±Standard Deviation.
674
haematologica | 2018; 103(4)
