
Page 129 - Haematologica-April 2018
P. 129
Global mRNA changes in stroma-bound lymphoma cells
c21 Chromosome organization,
Rho/ Rac family GTPase signaling and WNT signaling
c22 Kinetochore assembly/ function
c23 Mitotic centrosome
c24 Kinesins
Regulation of small GTPase mediated signal transduction, Chromosome organization and biogenesis, KEGG hedgehog signaling pathway
Reactome mitotic prometaphase
Reactome recruitment of mitotic centrosome proteins and complexes
Reactome kinesins
ACIN1, ARAP1, ARHGAP27, ARID1A, BMP7, BNIP3, BPTF, CDC42BPB, CREBBP, DDX11, DFFB, DMPK, EHMT1, ERCC4, FGD4, FGD6, GAS1, HDAC10, HDAC6, HUWE1, KAT2A, KAT6A, KAT6B, KDM4A,
MAP3K12, MRE11A, NOTCH2, NSD1, PDS5B, PIF1, PRKACB, PRMT7, RALBP1, SATB1, SMARCC2, STK36, TAF6L, TEP1, TERT, TOP2A, TSC1, WNT16, WNT5A, WNT6
CASC5, CDCA8, CENPA, CENPI, CENPT, CKAP5, CLASP1, NDC80, NUF2, RANBP2, SGOL2, SKA2,
TAOK1
AKAP9, ALMS1, CDK5RAP2, CENPJ, CEP135, CEP164,
CEP192, CEP70, CETN2, CKAP5, CLASP1, CNTRL, CSNK1E, DCTN1, DYNC1H1, DYNC1I2, OFD1, PCM1, PCNT, TUBB4A, TUBGCP6
KIF15, KIF18A, KIF20A, KIF23, KIF2C, KIF3C, KIF4A, KIF4B, KIF5A, KIF9, KIFC1, KLC3, KLC4
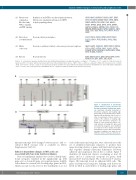
Clusters (C) of functional categories identified from Gene Set Enrichment Analysis leading edge analysis (see Figure 3): 17 clusters (c1-c17) contain 76 of 182 functional cat- egories and 455 of 653 genes with increased transcript levels in the adherent Jeko-1 fraction (ADH) of the co-culture as compared to MCL cells in suspension in co-culture (SUSP) and 7 clusters (c18-c24) contain 16 of 20 functional categories and 148 of 166 genes with decreased transcript levels in the ADH fraction. Genes with significantly higher (n=146) or lower (n=45) transcript levels in the ADH fraction as compared to SUSP are marked in red and blue, respectively.
A
B
Figure 3. Identification of functionally related clusters of genes by Gene Set Enrichment Analysis leading edge analy- sis. Heatmaps showing clustering of functional categories and leading edge genes that are up-regulated (A) or down- regulated (B) in adherent Jeko-1 cells rel- ative to suspension of Jeko-1 cells in co- cultures. The numbers of leading edge genes and functional categories are shown in each panel: 24 clusters (c1- c24), defined as having ≥10 genes and ≥1 functional categories, were identified (see Table 2 for more details). Four addi- tional groups of genes that contain many functional categories but which do not fulfill the cluster criteria are denoted i-iv.
each of the functional categories, were clustered across the set of identified functional categories to produce heat maps showing clusters of genes and functional categories that together identify functional differences between adherent and suspension cells in the co-culture. Figure 3 identifies 24 functional clusters (containing at least 10 genes and ≥ 1 functional category) for genes with increased (17 clusters, Figure 3A) or decreased (7 clusters, Figure 3B) transcript levels in adherent MCL cells. The genes and functional categories defining each cluster are listed in Table 2, and full lists of leading edge genes and
nificant transcript level changes between mono- and co- cultured MS-5 stromal cells is available in Online Supplementary Table S5.
Adhesion dependent changes in MCL cells are associated with four main functional themes
Gene set enrichment analysis was used to identify func- tional categories enriched in the significantly up- (182 gene sets) or down-(20 gene sets) regulated genes in MCL cells adhered to stromal cells. Leading-edge genes (n=819), which account for the level of the enrichment score for
haematologica | 2018; 103(4)
673
