
Page 89 - 2020_08-Haematologica-web
P. 89
Resolving mediators are altered in multiple sclerosis
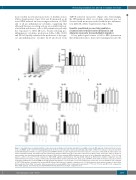
more evident in activated monocytes of healthy donors (Online Supplementary Figure S6A and B) inasmuch as all tested SPM induced an even stronger reduction of CD69 and of all pro-inflammatory cytokines, suggesting that although their pro-resolving actions are equally function- al in health and disease, cells of MS patients are probably less responsive to SPM. Of note, besides reducing pro- inflammatory cytokines production, LXA4, LXB4, RvD1 and PD1 all equally enhanced the production of the typi- cal anti-inflammatory cytokine IL-10 produced from
TLR7/8-activated monocytes (Figure 6C). Interestingly, the SPM-induced effect on cytokine reduction was not observed with monocytes treated with the pro-inflamma- tory LM LTB4 (Online Supplementary Figure S6C).
Specific specialized pro-resolving mediators counteract blood-brain barrier dysfunction and attenuate monocyte transendothelial migration
A key pathological feature of MS is BBB dysfunction that ultimately leads to monocyte transmigration into the
A
BC
Figure 6. Specialized pro-resolving mediators reduce monocyte activation and cytokine production in multiple sclerosis (MS) patients. Peripheral blood mononu- clear cells (PBMC, 2x10⁶ cells) from relapsing MS patients (n=5) were left untreated or pre-treated with LXA, LXB4, RvD1 or PD1 for 30 minutes. Cells were then stim- ulated with Imiquimod (Toll-like receptor 7 agonist) and ssRNA40 (Toll-like receptor 8 agonist) for five hours in absence or presence of Brefeldin A, stained at the cell surface and intracellularly, and analyzed by flow cytometry by gating on CD14+ monocytes. (A) Surface expression of CD69 positive monocytes. Data are shown as representative flow cytometry histograms and as means of fluorescence intensity (MFI)±standard error of mean of five independent experiments. **P<0.01 com- pared to control cells and ^P<0.05 compared to TLR7/TLR8 agonists, determined by one-way ANOVA followed by Bonferroni’s multiple comparison test. (B) Cytofluorimetric plots and percentages of intracellular pro-inflammatory cytokine production (IL-6, IL-12, IL1-b and TNF-a) from CD14+ monocytes. Data are presented as means± standard error of mean (SEM) of five independent experiments. **P<0.01 and ***P<0.001 compared to control cells, ^P<0.05 and #P<0.001 compared to TLR7/TLR8 agonists, determined by one-way ANOVA followed by Bonferroni’s multiple comparison test. (C) Cytofluorimetric plots and percentages of intracellular IL-10 production from CD14+ monocytes. Data are presented as means±SEM of four independent experiments. **P<0.01, ^P<0.05 and #P<0.001 compared to TLR7/TLR8 agonists, determined by one-way ANOVA followed by Bonferroni’s multiple comparison test.
haematologica | 2020; 105(8)
2065
