
Page 90 - 2020_08-Haematologica-web
P. 90
G. Kooij et al.
A
B
CD
E
FGH
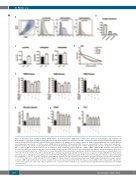
Figure 7. Specialized pro-resolving mediators (SPM) improve blood brain barrier (BBB) function and reduce monocyte transmigration and activation. (A) Representative scatter plots of forward scatter versus side scatter from human brain endothelial cells (BEC) and representative overlays histogram plot gated on live cells for GPR18/DRV2, GPR32/DRV1 and ALX/FPR2 surface expression. (B) Quantification of surface expression. Data are means±standard error of mean (SEM) of four independent experiments. (C) SPM receptors mRNA content in resting or TNF-a-activated BEC. Data are means±SEM of three independent experiments. Statistical analysis was carried out using Student t-test. ***P<0.001. (D and E) The functional effect of TNF-a (5 ng/mL) in the presence or absence of LXA4, LXB4, RvD1 or PD1 on BBB function was assessed by measuring the trans-endothelial electrical resistance (TEER) of BEC. Confluent BEC monolayer was treated as described and TEER was measured over time. Data are shown as representative TEER curves of three independent experiments. Graphs showing the TNF-a effect at selected time-points, plotted as % TNF-a effect of control BEC±SEM of three independent experiments. Statistical analysis was carried out using Student t-test. *P<0.05, **P<0.01, ***P<0.001. (F-H) Confluent BEC were stimulated for 24 hours with TNF-α in the presence or absence of LXA4, LXB4, RvD1 or PD1. Human monocytes (1x10⁵ cells/well) were left untreated or treated with LXA4, LXB4, RvD1 or PD1 prior plated on BEC. Cells were incubated for eight hours before harvesting the transmigrated cells. (F) Percentage of monocyte transmigration evaluated by flow cytometry. Data are shown as means±SEM of three independent experiments. ***P<0.001 compared to control cells and #P<0.001 compared to TNF-a stimulated cells, determined by one-way ANOVA followed by Bonferroni’s multiple compar- ison test. ICAM-1 expression by flow cytometry (G) and CCL2 secretion was measured by ELISA (H). Data are means±SEM of three independent experiments. ***P<0.001 compared to control cells, ^P<0.05 and #P<0.001 compared to TNF-a stimulated cells, determined by one-way ANOVA followed by Bonferroni’s multiple comparison test.
2066
haematologica | 2020; 105(8)
