
Page 74 - 2020_08-Haematologica-web
P. 74
E. Henry et al.
AB
C
D
E
FG
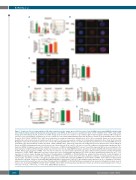
Figure 5. Low doses (LD) of ionizing radiations (IR) induce transitory reactive oxygen species (ROS) increase, 8-Oxo-dG DNA lesions and p38MAPK activation with altered mitochondrial activity in hematopoietic stem progenitor cells (HSPC). (A) ROS levels were quantified in CD34+ CD38low CD45RA– CD90+ HSPC using CellRox Orange probe immediately after IR. (Left) Pool of CellRox Orange mean of fluorecence relative to 0 Gy condition, right overlay histograms showing CellRox Orange flu- orescence. One representative experiment out of four is shown (see also Online Supplementary Figure S4). Results are shown as mean±standard error of mean. (B and C) CD34+ CD38low CD45RA– CD90+ HSPC were purified by cell sorting and exposed to different doses of IR or H2O2 as indicated. Shown are 8-oxo-dG lesions quantified by confocal microscopy 30 minutes post IR (at least 50 cells were screened by condition in 3 independent experiments. Blue: Dapi, Red: 8-oxo-dG). Histograms represent the intensity of fluorescence of 8-oxo-dG staining within HSPC nucleus. To avoid heterogeneity, mean fluorescence intensity (MFI) has been normalized to the sham-irradiated condition. (D) CD34+ CD38low CD45RA– CD90+ HSPC were purified by cell sorting and exposed to different doses of IR as indicated. Shown are NRF2 staining quantified by confocal microscopy 2 hours (h) post IR (at least 50 cells were screened by condition in 2 independent experiments. Blue: Dapi, Red: NFR2). Histograms represent the intensity of fluorescence of NRF2 staining within HSPC nucleus. To avoid heterogeneity, MFI has been normalized to the sham-irradiated condition. (E) Mitochondrial activity was monitored over time by using TMRE (membrane potential, left panel) and MTG (mitochondrial mass) probes in HSPC. Shown is the frequency of TMRE+ cells over time in culture for one representative experiment out of three independent experiments and the mitochondria activation (% of MTG+ TMRE+, right panel) over time in culture (pool of the 3 independent experiments). (F) CD34+ cells were irradiated and cultured 2 h at 37°C fol- lowed by cell surface marker staining and then fixed. Phosphorylation of p38MAPK on Thr180/Tyr182 was analyzed by flow cytometry. Overlay histograms of p38MAPK phosphorylation on CD34+ CD38low CD45RA– CD90+ HSPC (left panel) are represented for the three irradiation conditions. Overlay histograms are from one representative experiment out of three. Histogram bars (right panel) show the MFI of phospho-p38MAPK in CD34+ CD38low CD45RA– CD90+ HSPC (n=3 independent experiments). (G) CD34+ cells were treated with NAC, SB203580 (SB) or untreated for 1 h at 37°C then irradiated and cultured 2 h at 37°C. Staining for cell surface markers was performed and then cells were fixed. Phosphorylation of p38MAPK on Thr180/Tyr182 was analyzed by flow cytometry. Histogram bars show mean of fluorescence of phospho-p38MAPK in CD34+ CD38low CD45RA– CD90+ HSPC (n=3 independent experiments). Results are shown as mean±standard error of mean. *P<0.05, **P<0.01, ***P<0.001, ****P<0.0001 (Mann-Whitney statistics).
2050
haematologica | 2020; 105(8)
