
Page 134 - 2020_08-Haematologica-web
P. 134
A.K. Abdel-Aziz et al.
A
B
CD
E
F
G
H
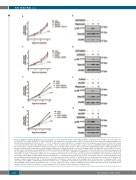
Figure 3. Inhibition of mTOR signaling reverses the resistance of acute myeloid leukemia cells to LSD1 inhibition. (A) Growth curves of THP-1 cells treated with vehi- cle, DDP38003 (0.5 mM), rapamycin (10 nM) or DDP38003 and rapamycin for the indicated time points of treatment. Data were statistically analyzed using two way ANOVA followed by Bonferrroni post hoc test, a,b,c: P<0.05 compared to vehicle, DDP38003 or rapamycin alone treated groups respectively (n=3). Note that we have previously demonstrated that LSD1 inhibition affects THP-1 cells in clonogenic but not in liquid culture assays.35 Indeed, co-inhibiting mTOR significantly augmented the anti-clonogenic activity of DDP38003 further promoting myeloid lineage differentiation of THP-1 cells (Online Supplementary Figure S3A-B). (B) Western blot analysis of lysates obtained from THP-1 cells (A) following 72 hours (h) of treatment. b-actin served as the loading control. (C) Proliferation curves of THP-1 cells treat- ed with vehicle, DDP38003 (0.5 mM), AZD8055 (20 nM) or DDP38003 and AZD8055 for the indicated time points of treatment. Data were statistically analyzed using two way ANOVA followed by Bonferrroni post hoc test, a,b,c: P<0.05 compared to vehicle, DDP38003 or AZD8055 alone treated groups respectively (n=3). (D) Western blot analysis of lysates obtained from THP-1 cells (C) following 72 h of treatment. b-actin served as the loading control. (E) Growth curves of transduced THP-1 cells expressing control shRNA or shRNA against LSD1 treated with vehicle or rapamycin for the indicated time points of treatment. Data were statistically analyzed using two way ANOVA followed by Bonferrroni post hoc test, a,b,c:P<0.05 compared to vehicle, shLSD1 or rapamycin alone treated groups respectively (n=3). (F) Western blot analysis of lysates obtained from THP-1 cells (E) following 144 h of treatment. b-actin served as the loading control. (G) Growth curves of transduced THP-1 cells expressing control shRNA or shRNA against LSD1 treated with vehicle or AZD8055 for the indicated time points of treatment. Data were statistically analyzed using two way ANOVA followed by Bonferrroni post hoc test, a,b,c: P<0.05 compared to vehicle, shLSD1 or AZD8055 alone treated groups respectively (n=3). (H) Western blot analysis of lysates obtained from THP-1 cells (G) following 144 h of treatment. b-actin served as the loading control.
2110
haematologica | 2020; 105(8)
