
Page 65 - 2020_07-Haematologica-web
P. 65
Temporal and spatial emergence of GATA1 complex
the threshold parameters used in our study to detect the strongest differentially expressed genes. In P1 and P2, 65% of the downregulated genes are enriched for e.g. neu- trophil degranulation, cytokine production and hemosta- sis, i.e. genes crucial for other cell types (Figure 3D). The up-regulated genes (35%) represent essential functions for erythroid genes, e.g. erythrocyte homeostasis, porphyrin- synthesis and cell cycle genes as cells at this stage are still replicating. During mid- (P2 to P3) or late (P3 to P4) differ- entiation, the majority (76% and 67%) of upregulated
genes have erythroid differentiation bio-functions. Down- regulated genes, (24% and 33%) show functions like lym- phocyte differentiation, B-cell differentiation and lympho- cyte migration. At these stages (P3 to P4), cell cycle func- tions are suppressed as erythroid cells enter the terminal differentiation and proceed to enucleation. Next GATA1/LDB1 PLA was applied on the four sorted popula- tions (Figure 4A), showing high signals in P2 and P3. Quantification confirmed that P2 had the highest density of GATA1/LDB1 interaction signals per nuclear area
ABC
D
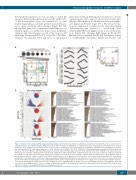
Figure 3. Fetal liver cell sorting and RNA-sequencing data analysis. (A) Schematic description of erythroblast development. Fetal liver (FL) cells are sorted into four populations based on membrane markers TER119 and CD71. Different stages of erythroblasts are indicated into P2 to P4 populations. The C-KIT positive cell pop- ulation (P1, CD71–/TER119–) represents precursors or other lineage cell types present before the initiation of erythroblast maturation. Proerythroblasts/colony form- ing unit-erythroid [CFU-E] cells) express high level of CD71 and low level of TER119 (P2, CD71+/TER119–). Following erythroblast maturation, TER119 expression increases (P3, CD71+/TER119+). When the differentiation reaches the orthochromatic stage, they loose CD71 expression (P4, CD71–/TER119+). Pro: immature proery- throblast; Baso: basophilic erythroblast; Poly: polychromatic erythroblast; Orth: orthochromatic erythroblast; Ret: reticulocytes; Ery: erythrocyte. Gray bars represent the changes of c-Kit, Cd71 and Ter119 gene expression. The darker color of the bar represents higher expression for the indicated gene. (B) Quantitative PCR on indicated genes in E12.5 or E13.5 sorted FL cells (E12.5 and E13.5 were used as duplicates) as described in Panel A. Relative expression values are calculated by comparing to control gene Rnh1. (C) Principle component analysis of RNA-sequencing data from two replicates of each P1 to P4 sorted FL cells as described in (A) (D) The total number of down-regulated or up-regulated differentially expressed genes (DEG) are shown for each comparison in a Volcanoplot, in which x-axis repre- sents log two-fold change and y-axis represents log 10 adjusted P-value. Significant DEG are shown in blue for down-regulated and red for up-regulated. Gray dots represent the non-significant genes. The ratio of down- or up-regulated DEG in each comparison is shown in pie-chart inserted in the Volcanoplot. Top 20 gene ontol- ogy terms for down- or up-regulated DEG in each comparison are shown.
haematologica | 2020; 105(7)
1807
