
Page 64 - 2020_07-Haematologica-web
P. 64
X. Yu et al.
A
B
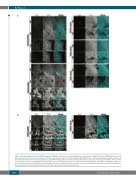
Figure 2. Proximity ligation assay of GATA1 complexes in E12.5 fetal liver tissue. (A) Proximity ligation assay (PLA) for GATA1/FOG1 and GATA1/LDB1 interactions was performed on sections of mouse fetal liver (FL) tissue at embryonic day 12.5 (E12.5), together with GATA1, FOG1 or LDB1 single-primary antibody negative con- trols. PLA protein interactions were visualized in red, and DAPI staining in blue was used to visualize the nucleus (scale bars, 50 μm in 20x and 40x). For each inter- action zoom-in pictures corresponding to the white square area are also shown (scale bars, 20 μm in 63x). Z-stack images of each protein combination and fluores- cent channels were projected by Maxi-Projection algorithm. (B) PLA for GATA1/LMO2 was performed as in Panel A using LMO2 antibodies replacing FOG1 antibodies. Scale bars represent 50 μm apart fromscale bars in zoom in picures bars which represent 10 μm.
1806
haematologica | 2020; 105(7)
