
Page 62 - 2020_07-Haematologica-web
P. 62
X. Yu et al.
A
B
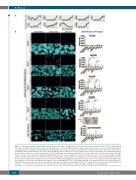
Figure 1. Gene expression and proximity ligation assay on embryonic stem cell differentiation. (AcGene expression during embryonic stem (ES) cell differentiation from day 0 until day 6 (D0-D6) of genes of interest. Standard error of the mean (SEM) from three biological replicates is shown as error bar. (B) Proximity ligation assay (PLA) detection of GATA1/FOG1, GATA1/LDB1 and LDB1/E2A complexes was performed on wild-type ES cell differentiation at D0 (ES cells), D4, D5 and D9, and Ldb1-KO ES cell differentiation at D9. On D9, EB from wild-type (WT) or Ldb1-KO are collected and pictured as shown. PLA signal representing protein-protein interaction was in white on a black background and in Texas-Red in merged pictures together with DAPI in blue. Each red dot represents a fluorescent signal of GATA1 complex formation. The images were analyzed using BlobFinder software38 which quantifies the number of PLA-positive dots in cells. The boxplot (Figure 1B, right panel) shows the density of the dots related to its nuclear area (from three biological replicates). Comparisons of the PLA signals obtained with two primary antibod- ies versus those obtained in the negative controls were tested in ANOVA and the significance is shown in asterisks. All scale bars represent 10 μm. PLA signals have been quantified on each day and compared with negative controls including GATA1, FOG1, or E2A single-antibody or secondary antibodies alone. Asterisk shows the significant interactions between the two primary antibodies PLA signal and single primary antibody controls. The significance was analyzed with Kruskal-Wallis test as follows, ****: P≤0.0001, ***: P≤0.001, **: P≤0.01, *: P≤0.05. The Tukey method to counteract multiple comparison errors was applied.
1804
haematologica | 2020; 105(7)
