
Page 67 - 2020_07-Haematologica-web
P. 67
Temporal and spatial emergence of GATA1 complex
A
B
C
D
E
F
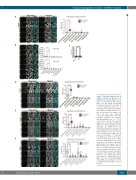
Figure 5. Proximity ligation assay on GATA1 complexes in MEL cells. (A) GATA1/FOG1 proximity ligation assay (PLA) on non-induced and induced MEL cells. PLA signal representing protein-protein interaction in white in a black background and in red in merged pictures together with DAPI in blue. GATA1 or LDB1 antibody alone was also performed as negative con- trols. All scale bars represent 20 μm. The significance from three biological replicates was analyzed with Kruskal-Wallis test as ****: P≤ 0.0001 and *: P≤0.05. The statistical significance is determined by Kruskal- Wallis test (Tukey method). (B) PLA detection of GATA1/FOG1 and GATA1/TAL1 interaction compared to non-existing interaction FOG1/TAL1 in MEL non-induced cells. The PLA sig- nal is separated into relative ratio in nucleus or cytoplasm. ****Indicates the significance (P≤0.0001) between indicated interactions and is deter- mined by Kruskal-Wallis test (Tukey method). (C) The volume of individual GATA1/LDB1 PLA signals from 53 MEL non-induced and 56 induced cells is calculated following deconvo- lution and shown in boxplot. P-values of both statistical analysis of paramet- ric (t-test) and non-parametric (Mann- Whitney) are 0.827 and 0.674, respectively. (D) GATA1/LDB1 PLA on MEL cells as in (A) (E) LDB1/LMO2 PLA on MEL cells as in Panel A. Panel F: LDB1/ETO2 PLA on MEL cells as in Panel A.
haematologica | 2020; 105(7)
1809
